
Why Use Filtering?
Team Insights allows you to customise the analysis to focus on specific time periods and work item types. This helps you gain deeper insights into particular aspects of your team's delivery.
Accessing Filters
To access the filtering options:
-
Navigate to the Team Insights tab
-
Click the Filters button in the top right corner of the page
-
The filter panel will open on the right side
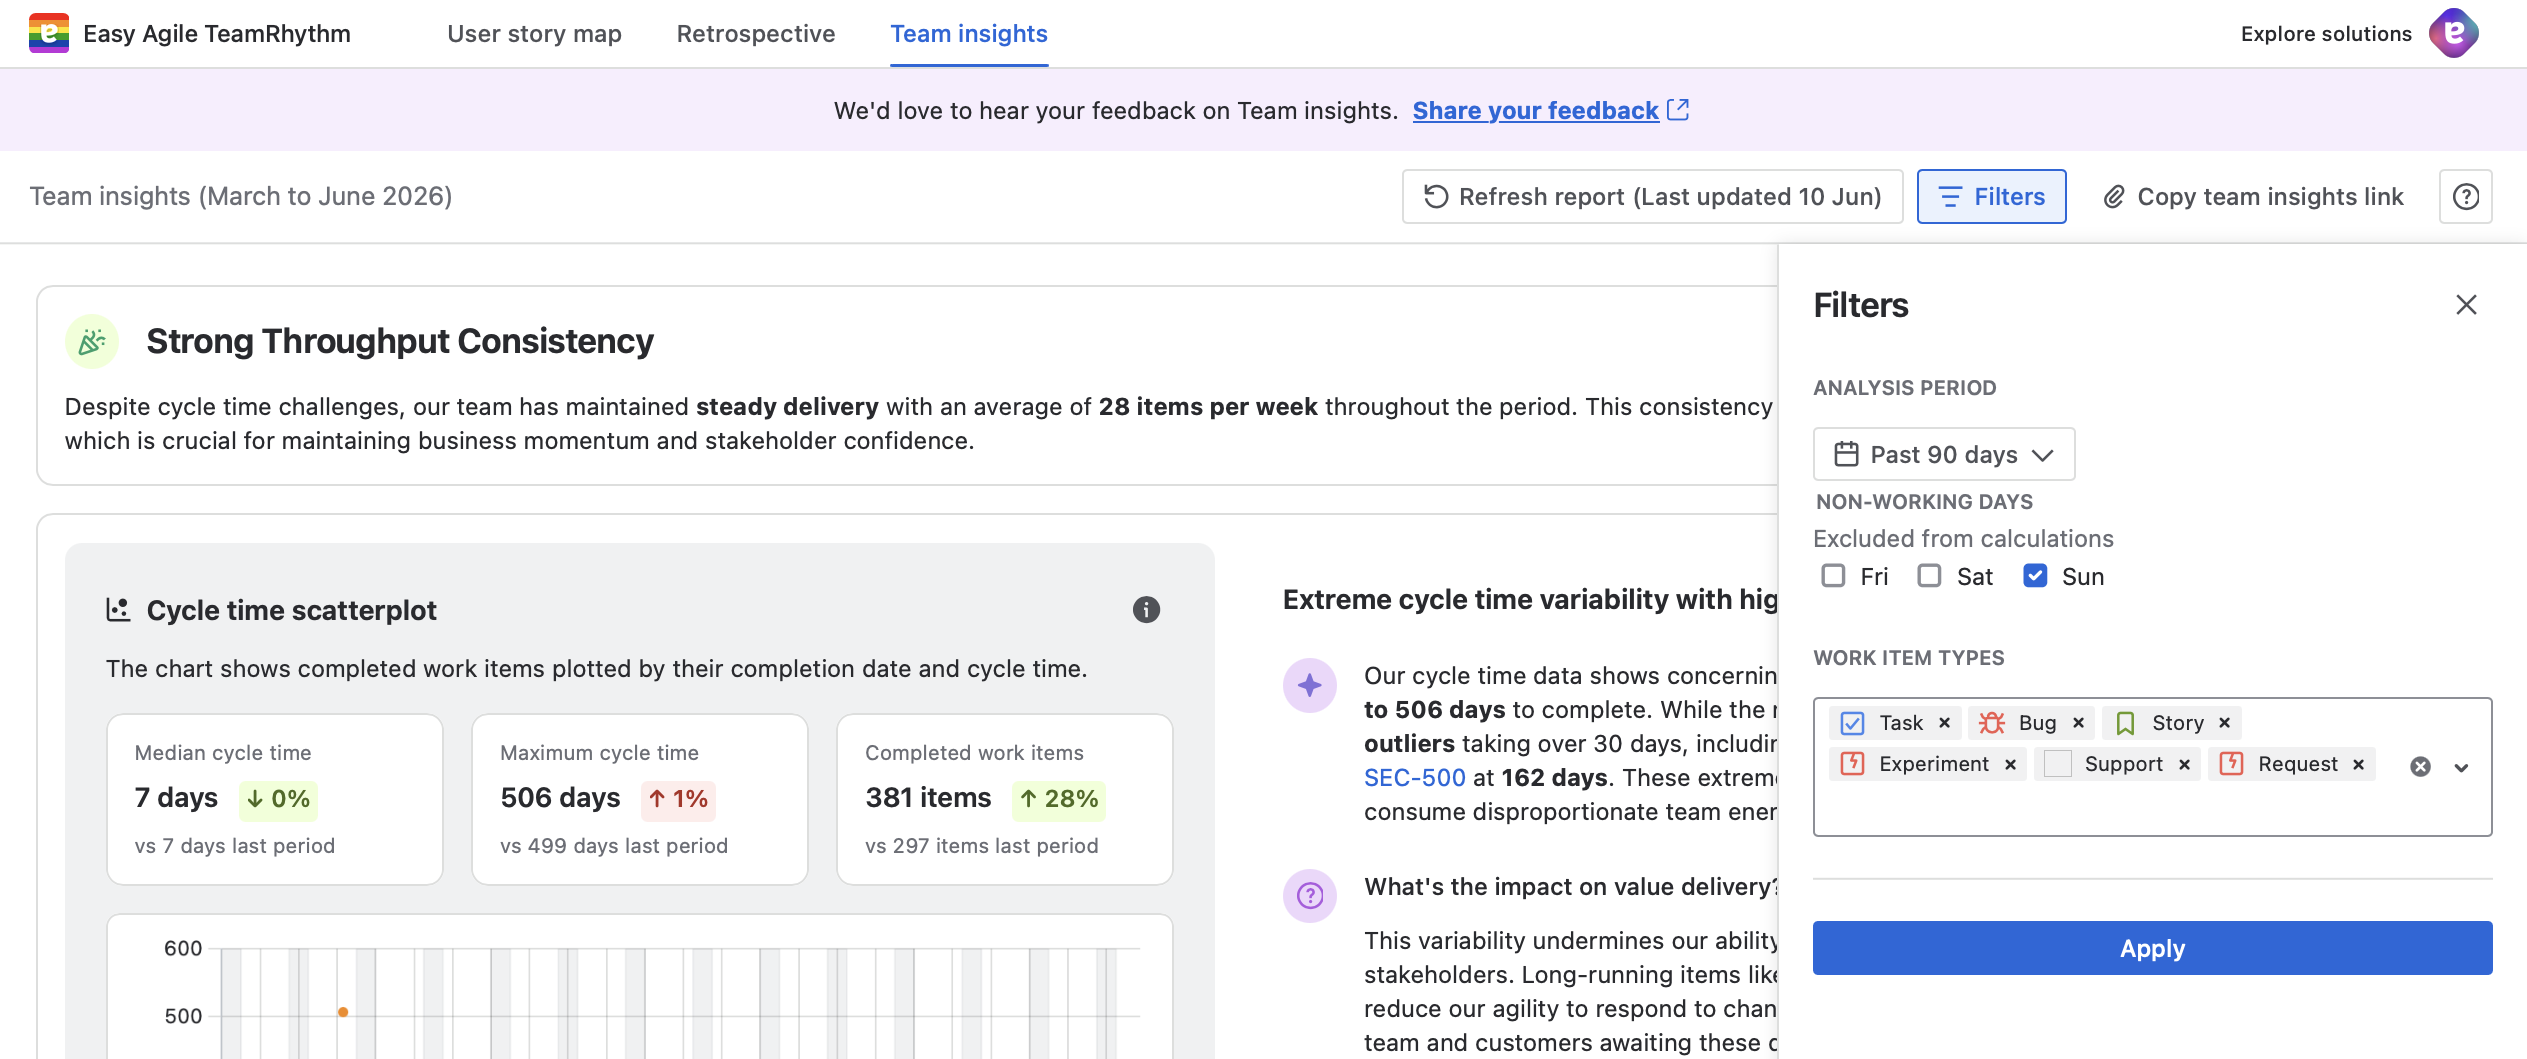
The filters button displays the number of active filters (e.g. "Filters / 3" means three filters are currently applied).
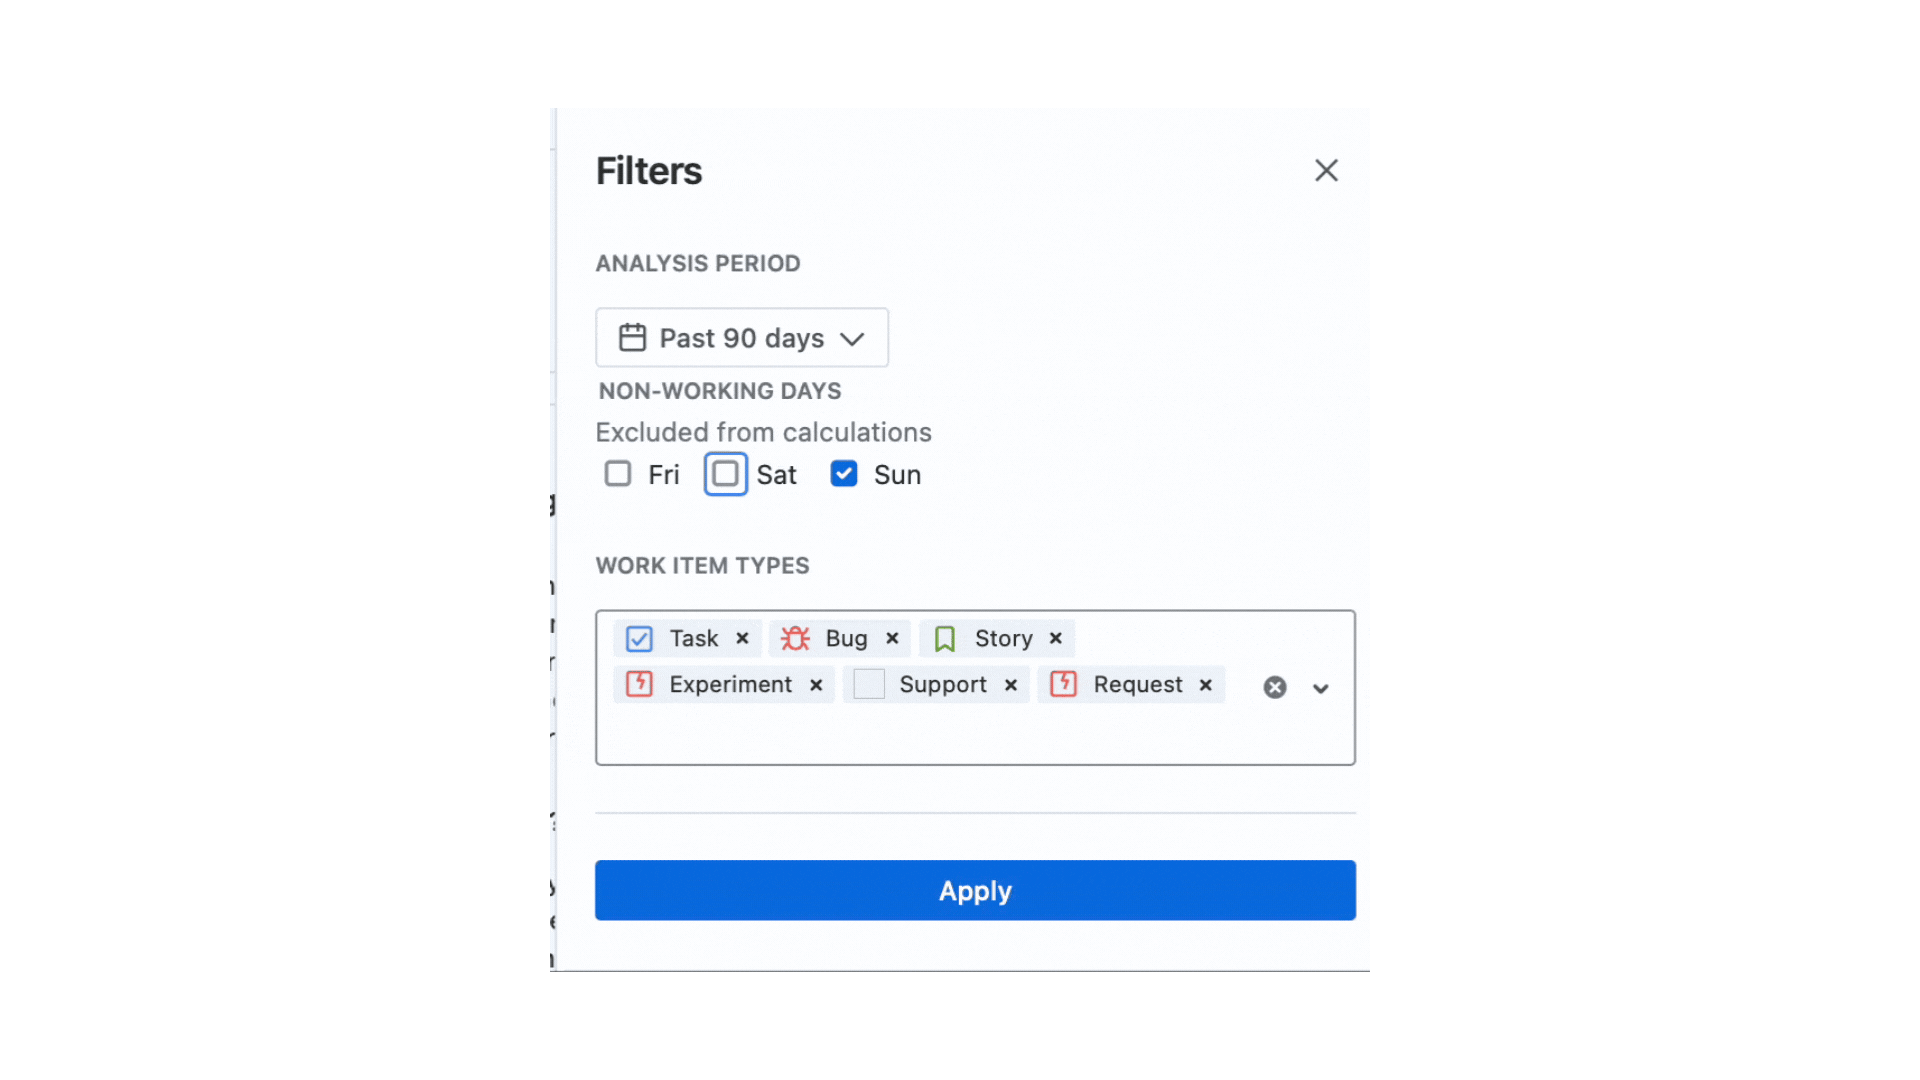
Analysis Period
The Analysis Period filter allows you to focus on a specific time range for your insights.
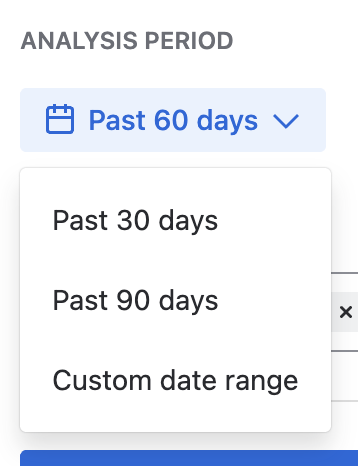
Available Options
-
Past 30 days
-
Past 60 days (commonly used default)
-
Past 90 days
-
Custom date range
How to Change the Analysis Period
-
Click on the Analysis Period dropdown
-
Select from the preset options (Past 30 days, Past 60 days, Past 90 days)
-
Or select Custom date range to specify exact start and end dates
Why Analysis Period Matters
The time period you select affects all charts and insights displayed in Team Insights. A longer period provides more data for trend analysis, while a shorter period focuses on recent performance. The time period selection currently refers to calendar days.
Best practices:
-
Use Past 30 days for recent sprint retrospectives
-
Use Past 60 days for general team health checks (recommended starting point)
-
Use Past 90 days for quarterly reviews and longer-term trend analysis
-
Use Custom date range for specific project phases to align with your organisation's reporting periods (min. 7 days, max. 90 days)
Work Item Types
The Work Item Types filter allows you to focus the analysis on specific types of work items, such as Tasks, Bugs, Stories, Feature Requests, Experiments, or Support tickets.
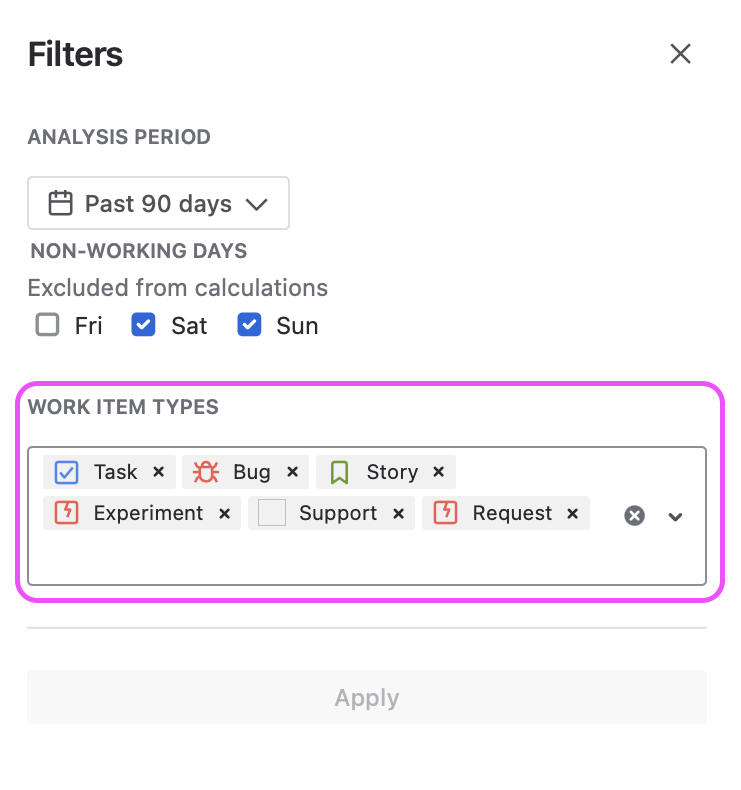
How to Filter by Work Item Type
-
In the Filters panel, locate the Work Item Types section
-
By default, common work item types (Task, Bug, Story) are selected
-
Click the X next to any work item type to remove it from the filter
-
Click the dropdown arrow or clear button to see all available work item types
-
Select additional work item types by clicking on them
Available Work Item Types
The available work item types depend on your Jira configuration. Common options include:
-
Task (✓ checkbox icon)
-
Bug (🐞 bug icon)
-
Story (📑 bookmark icon)
Why Filter by Work Item Type
Filtering by work item type allows you to:
-
Compare performance across types: See if bugs are taking longer than stories
-
Focus on specific work: Analyse only feature development or only bug fixes
-
Identify patterns: Understand if certain types of work have consistent bottlenecks
-
Tailor retrospectives: Focus discussions on specific types of work
Example scenarios:
-
Filter to only Bugs to analyse your team's defect resolution process
-
Filter to Stories to understand feature delivery cycle time
-
Combine Task and Story to exclude bugs from your main flow analysis
-
Select only Feature Request to review how customer-requested features are progressing
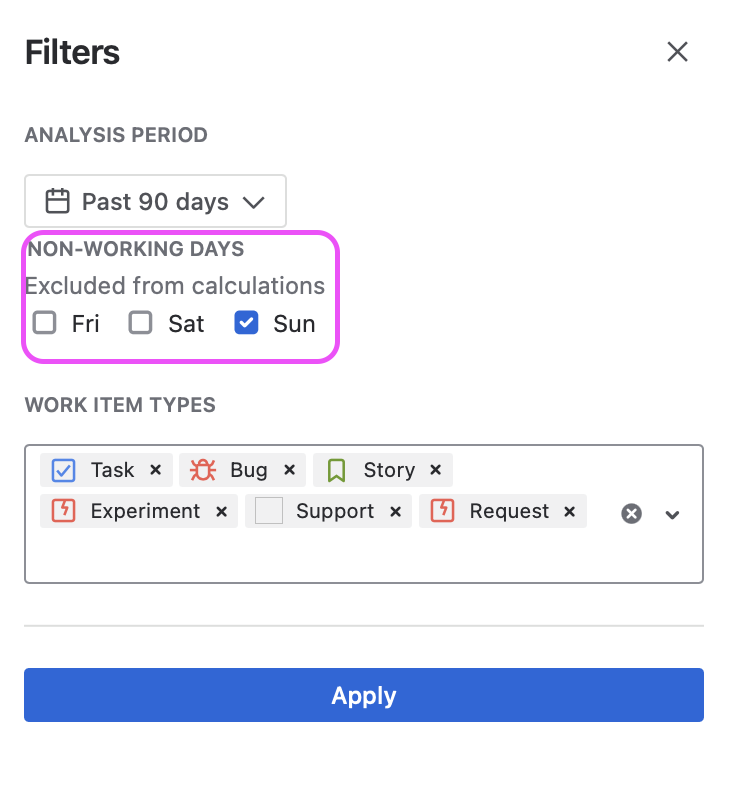
Excluding non-working days from the Team insights report
The Non-working Days filter lets you customise your Team insights report to either include or exclude weekends based on your operational needs.
How to exclude non-working days from Team insights report
-
In the Filters panel, locate the Non-working Days section
-
Select any non-working days that you want to exclude from the calculations (i.e Friday; Saturday; Sunday) by clicking on them. Multiple choices is available.
-
Click Apply to refresh the report accordingly.
Applying Filters
Once you've selected your desired filters:
-
Review your selections in the filter panel
-
Click the Apply button at the bottom of the filter panel
-
Team Insights will refresh with the new filter criteria
The page will reload and regenerate insights based on your filtered selection. This may take a few moments as the analysis is recalculated.
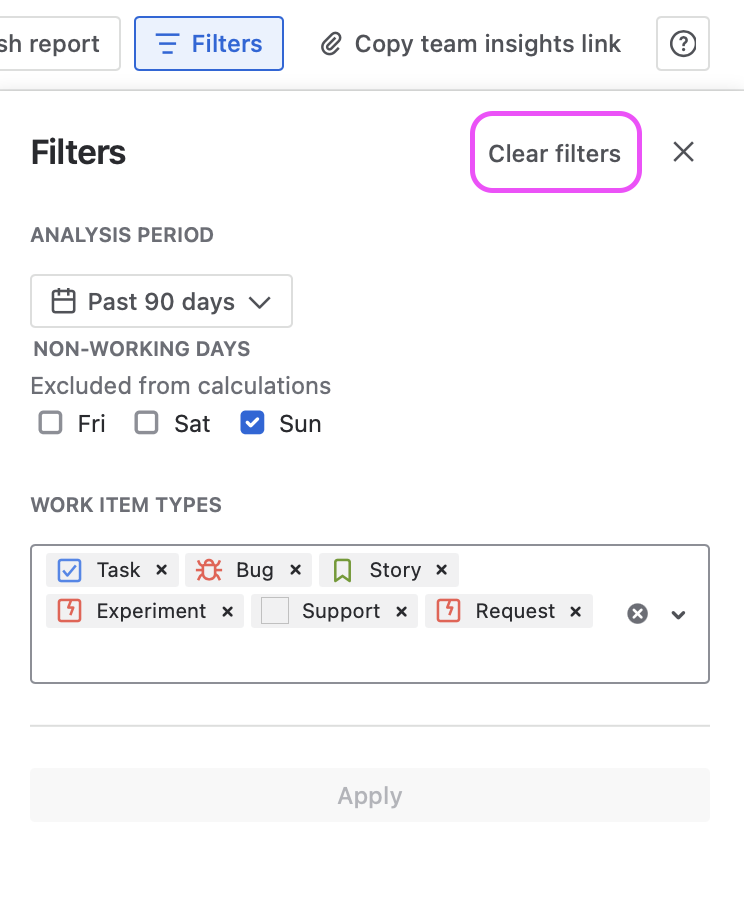
Clearing Filters
To remove all filters and return to the default view:
-
Click the Clear filters link in the top right of the filter panel
-
Or click Apply after manually removing individual filters
Understanding Filtered Results
When filters are applied:
-
The filter count is displayed on the Filters button (e.g. "Filters / 3")
-
All charts update to show only the filtered data
-
All insights and recommendations are recalculated based on the filtered dataset
-
Work item keys mentioned in insights will only include items matching your filter criteria
Impact on Charts
Each chart responds to your filter selections:
-
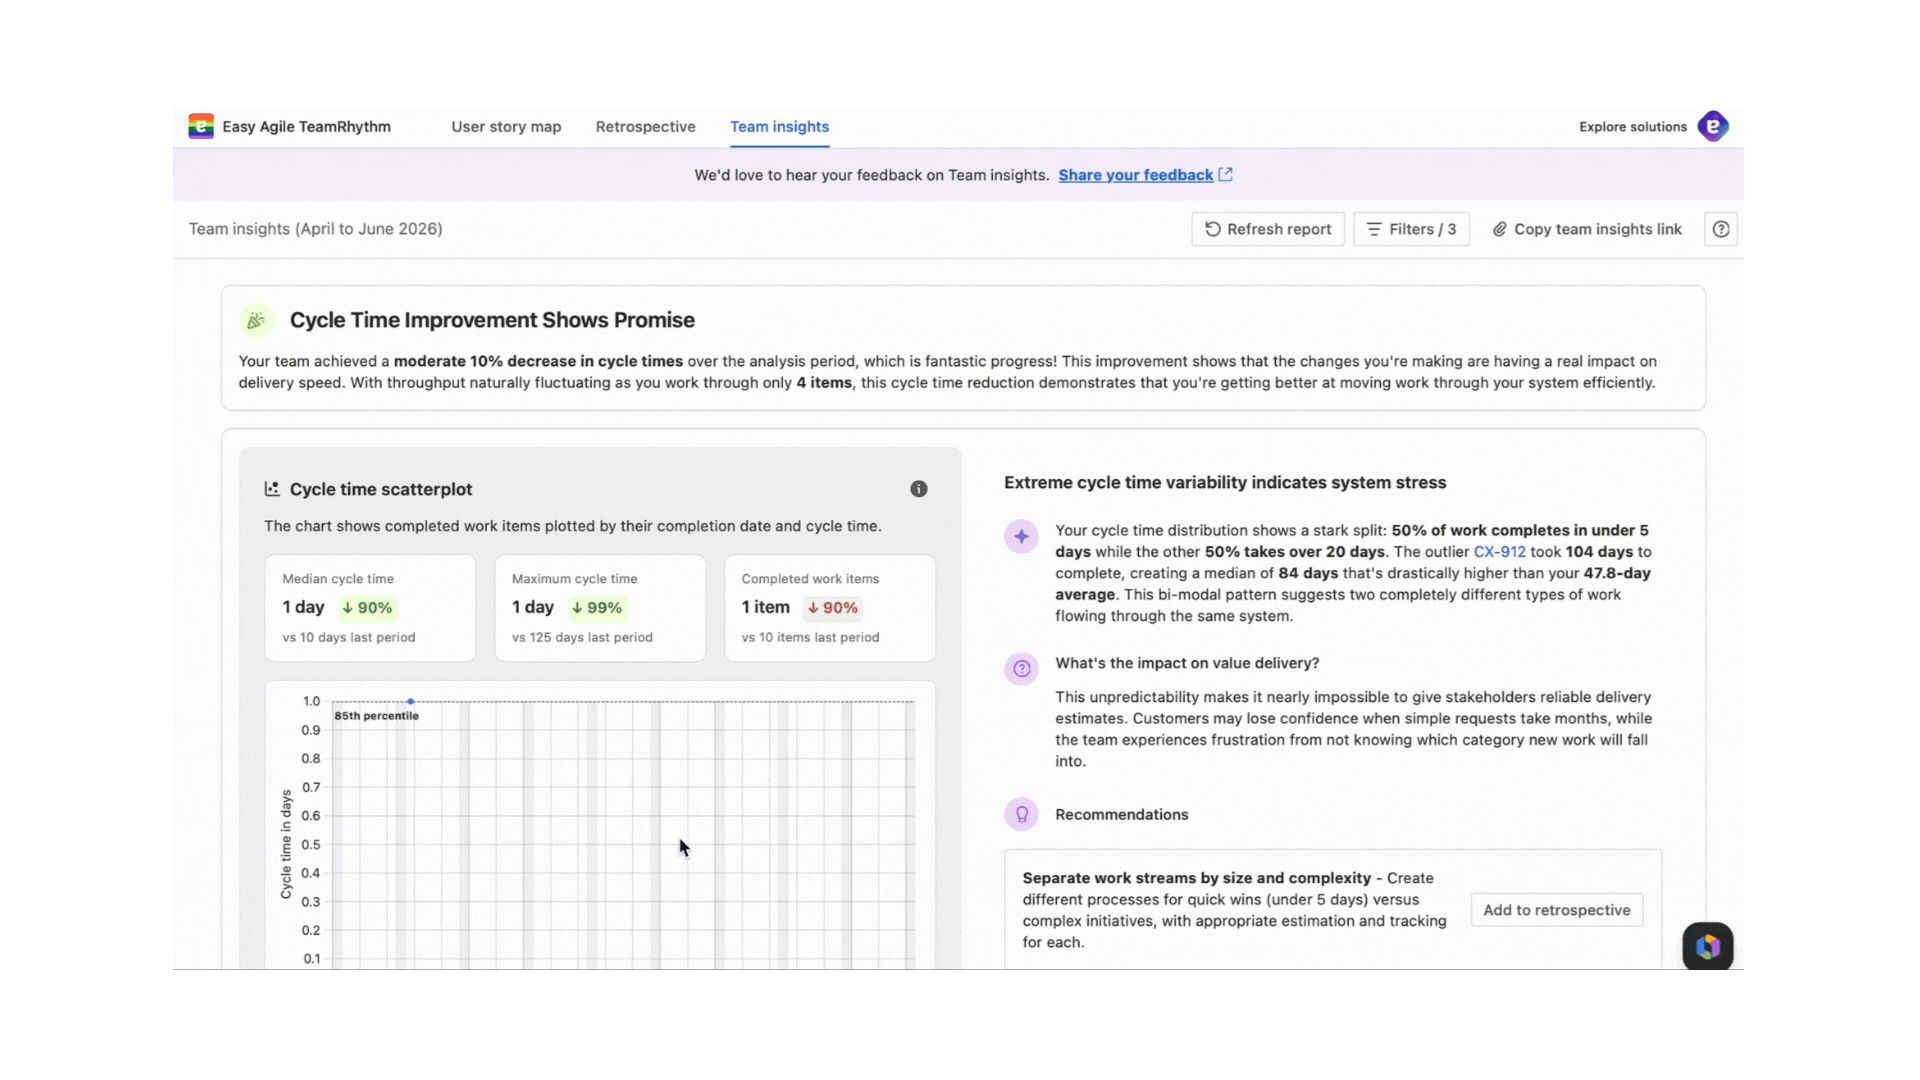
Cycle Time Scatterplot: Shows only work items of the selected types completed in the analysis period
-
Throughput: Displays completion rates for only the filtered work item types
-
Daily WIP by Age: Shows work in progress for only the selected types
Tips for Effective Filtering
Start broad, then narrow: Begin with the default settings (Past 60 days, all work item types) to get an overall picture, then apply filters to investigate specific areas.
Compare time periods: Run Team Insights with "Past 30 days" and then "Past 90 days" to understand if recent changes are trends or anomalies.
Isolate work types: If your insights show concerning patterns, filter to individual work item types to identify which type is driving the issue.
Align with team discussions: Before a retrospective, filter to match the sprint or time period you're reviewing.
Document your filters: When sharing insights with stakeholders, note which filters were applied to provide context.
Filter Limitations
-
Filters apply to the entire Team Insights view and cannot be set differently for individual charts
-
Filtering to very small datasets (e.g. only 2-3 completed items) may result in limited or less meaningful insights
-
Custom fields and labels are not currently supported as filter options