
How Team Insights Works
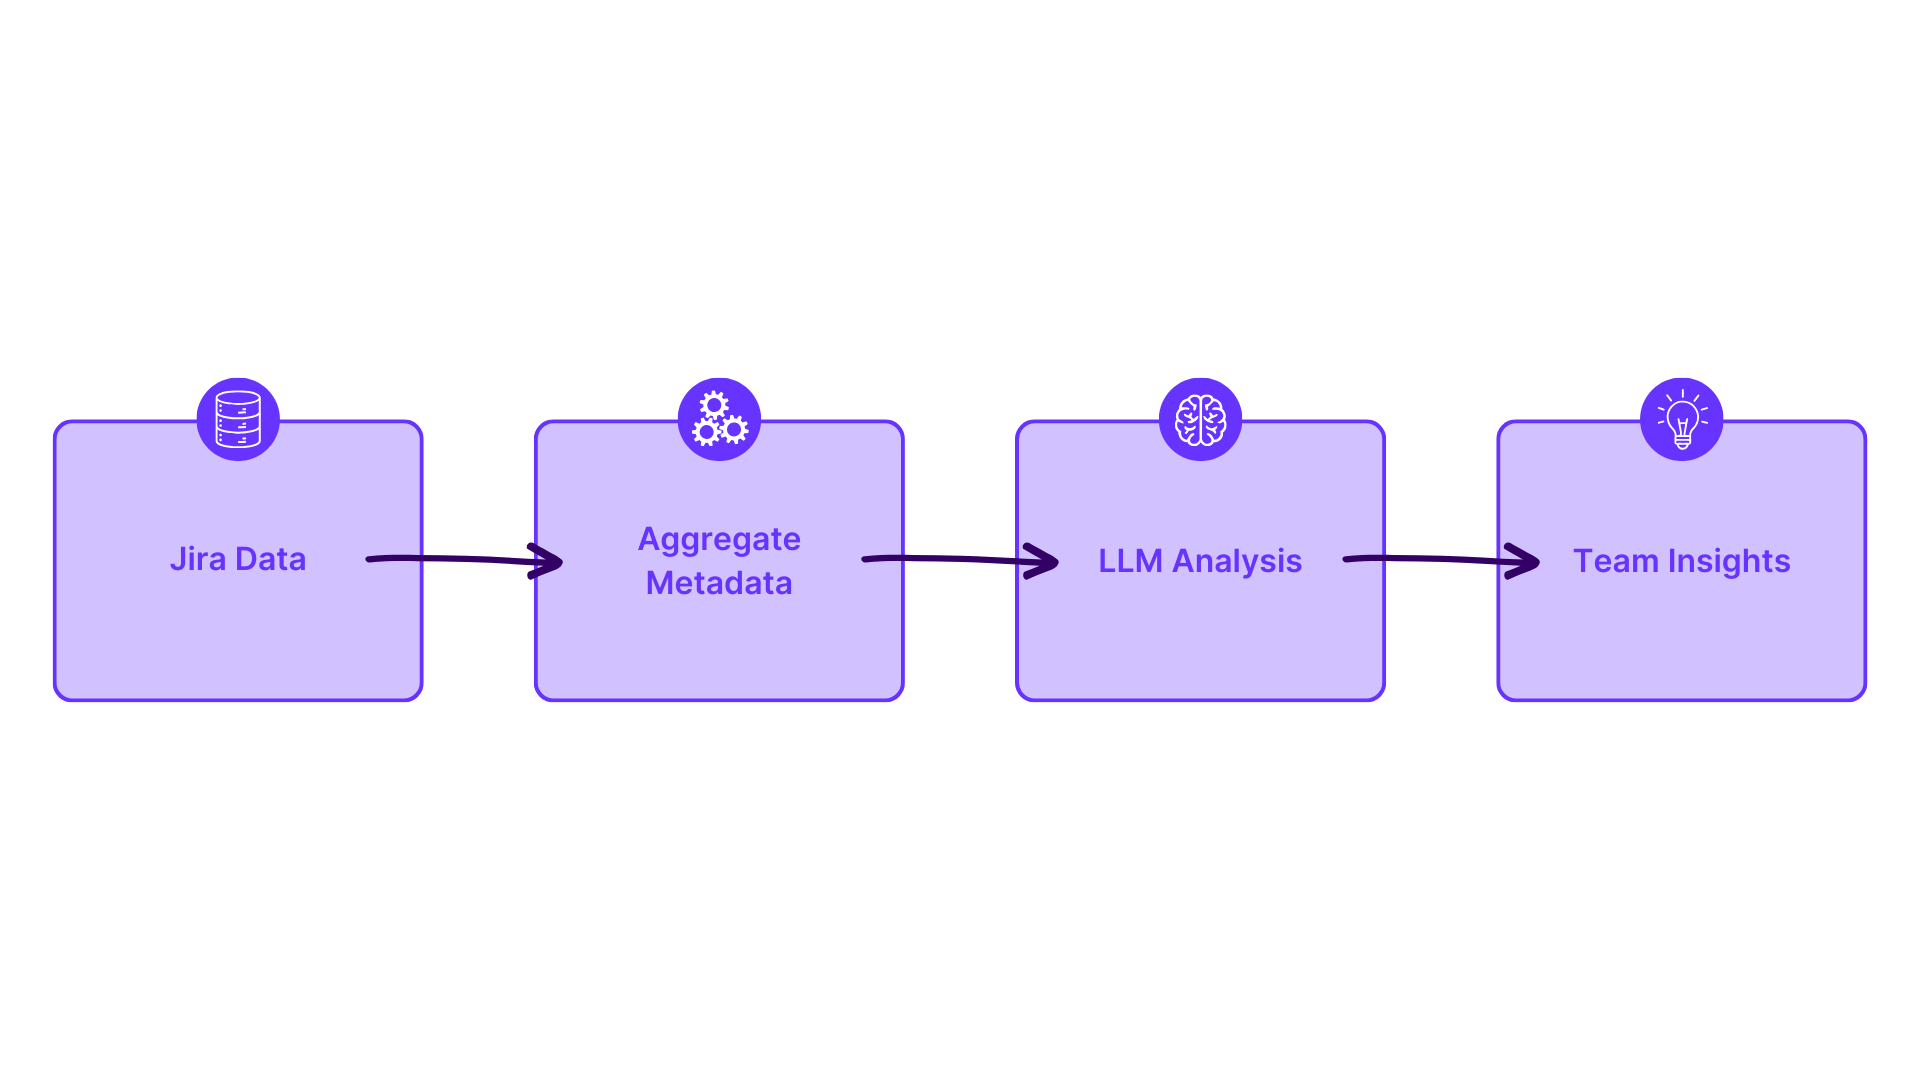
Team Insights is generated by sending aggregate metadata, no customer Jira data, to a Large Language Model (LLM) that has been trained on agile expertise and principles.
We analyse the quantitative data for an Agile Board then craft aggregate metadata statistics. From there the LLM interprets the metadata and provides insights and recommendations specific to this team at this point in time.
Key Components of Team Insights
Celebration
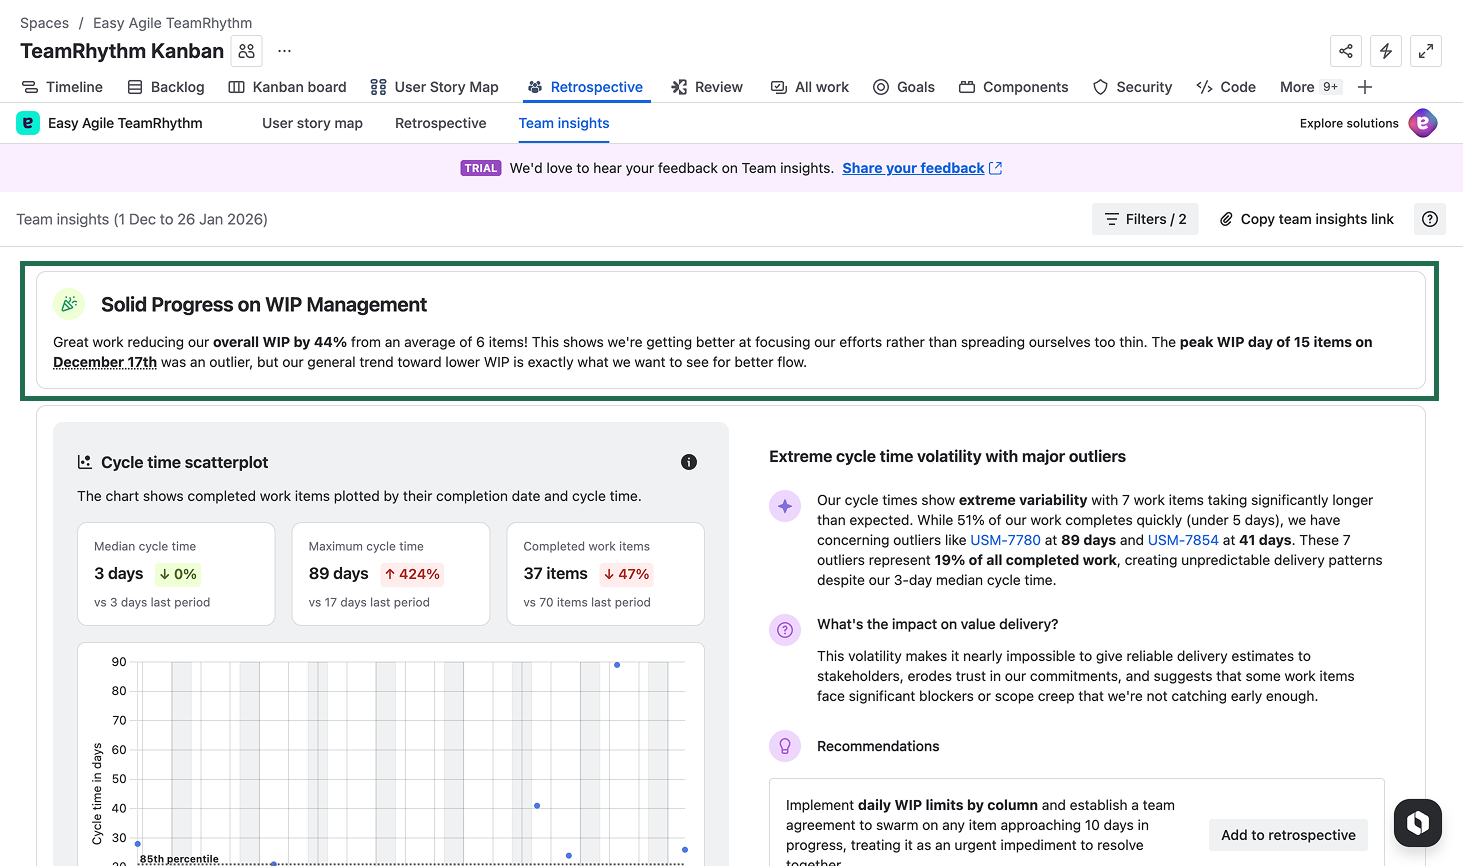
Where we can see positive signal, we start the report with encouragement. This appears as a prominent banner at the top of the insights with a headline summarising the positive change.
For example:
"Strong WIP Management Progress — Your team has made dramatic progress on WIP, with improvements in cycle time and work-in-progress items."
The celebration section is designed to acknowledge what's working well before diving into areas for improvement, helping set a constructive tone for team discussions.
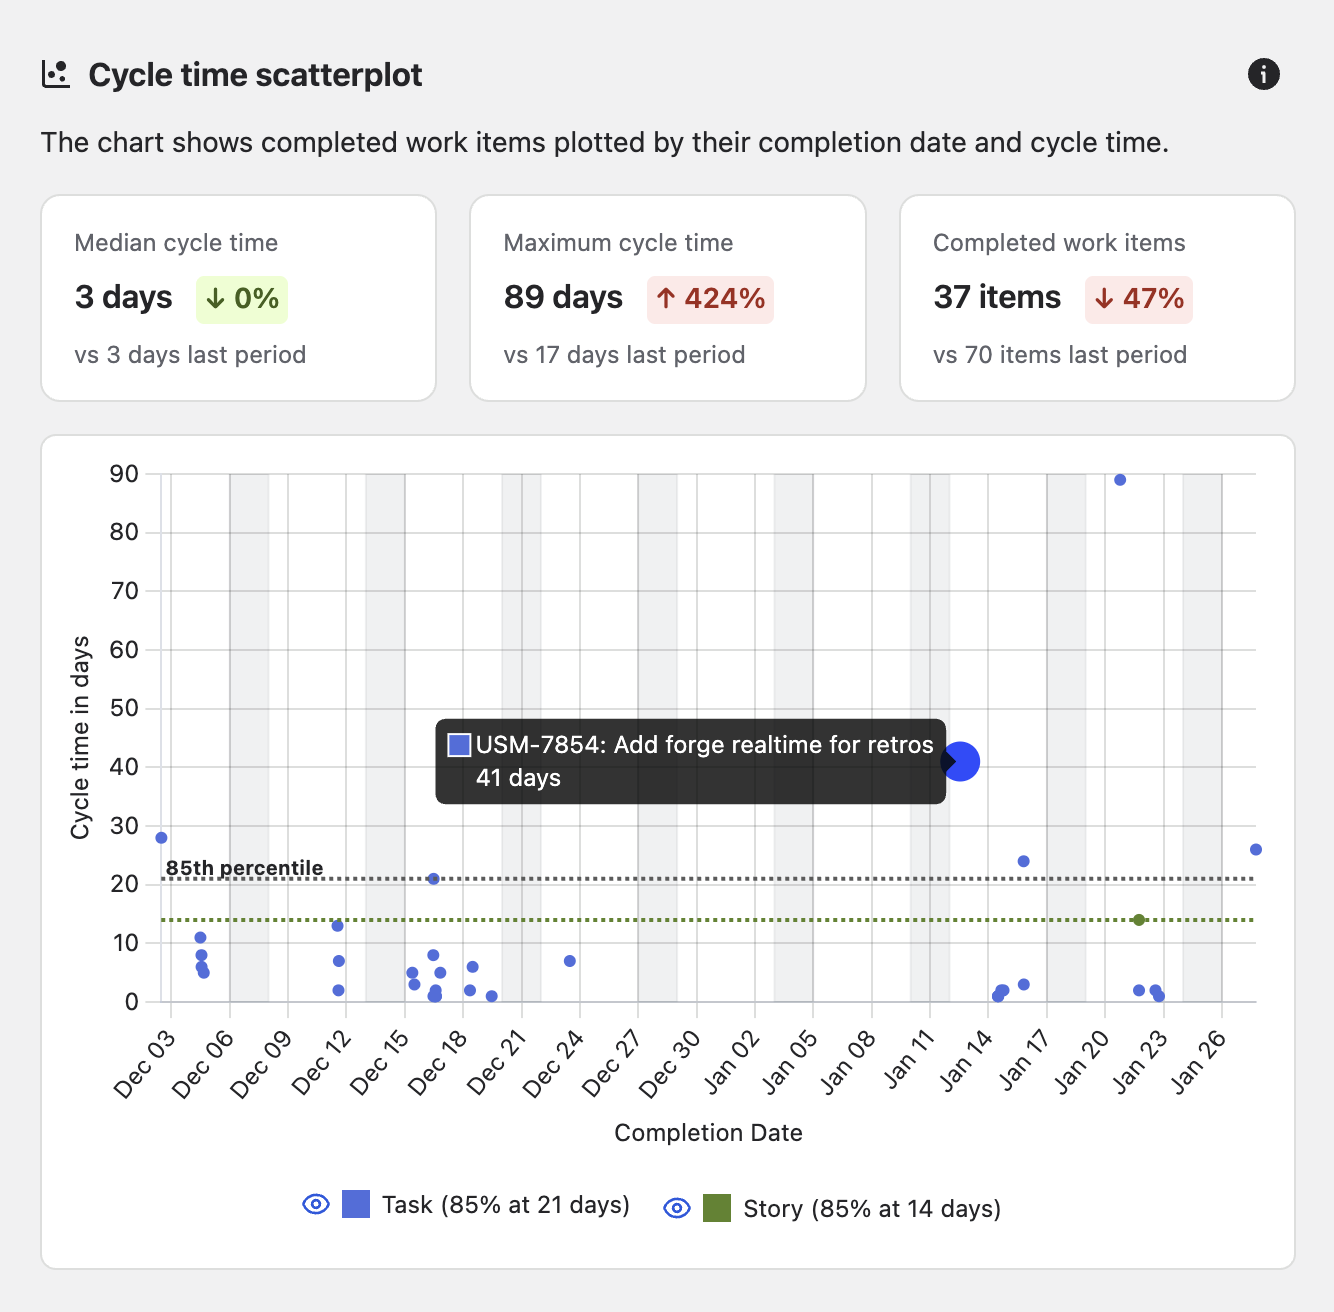
Cycle Time Scatterplot
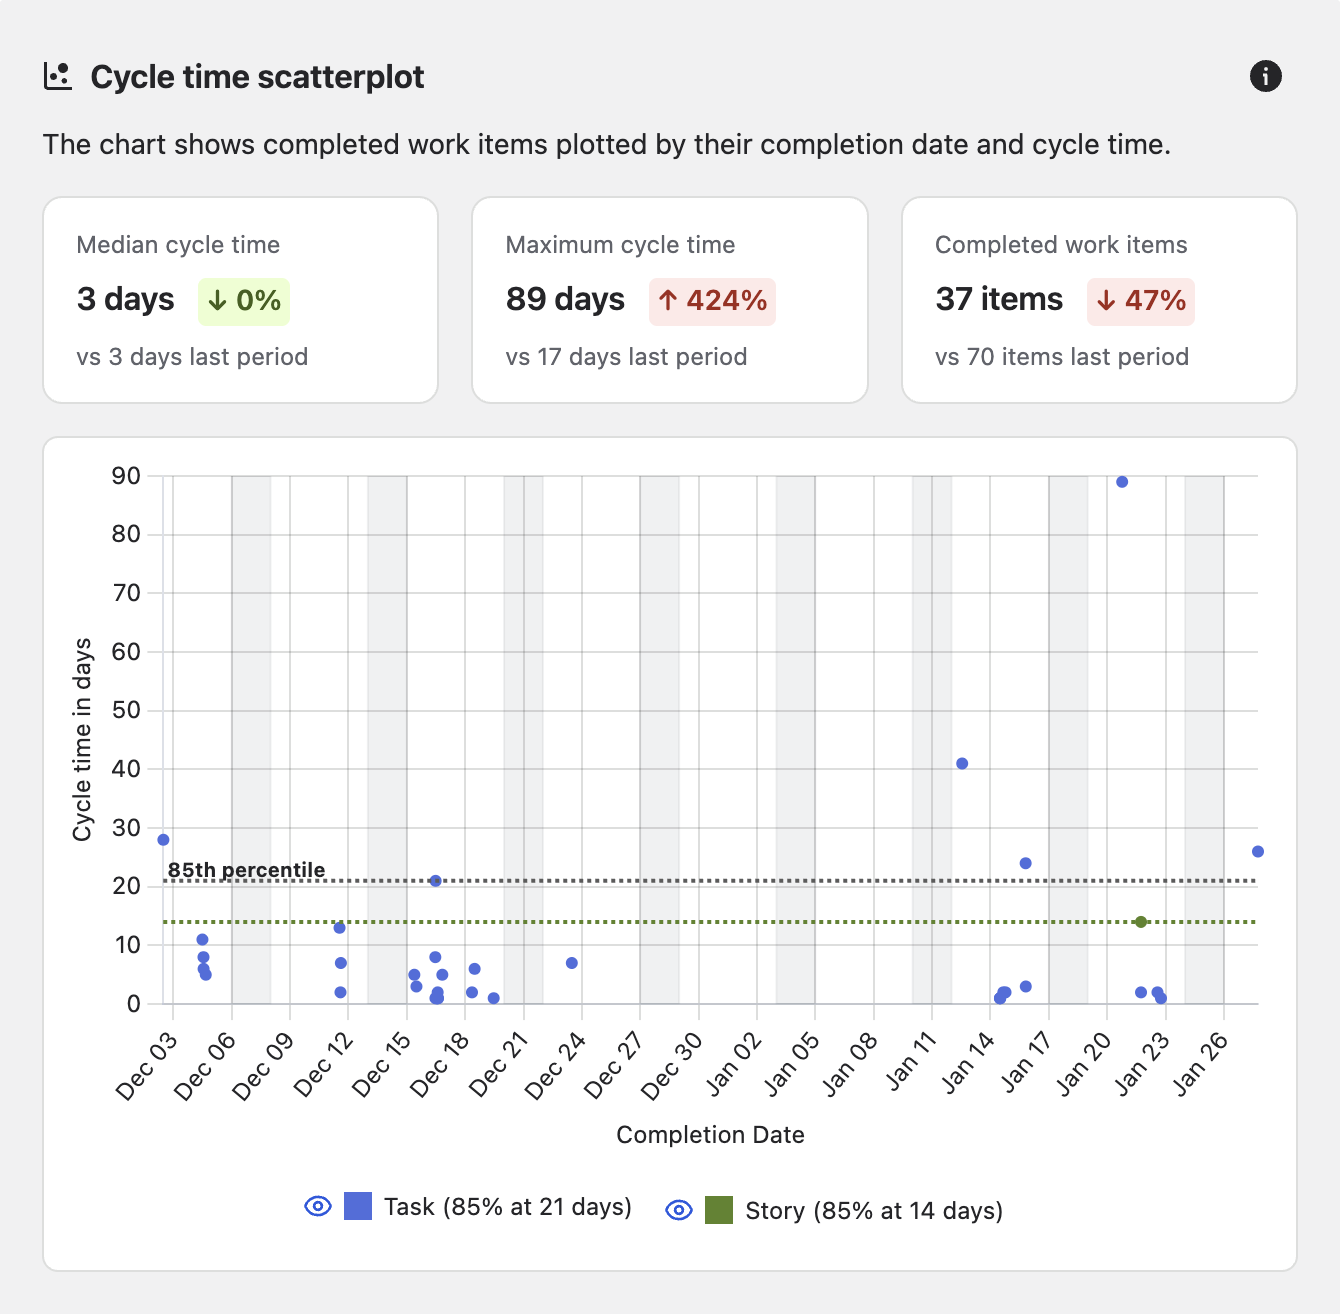
Our primary report is the cycle time scatterplot, designed to focus the team on the flow of work items across their agile board. There is a dot on the chart for every work item that is completed in the time period, and you will see 85th percentile lines for each of issue type.
What does 85th percentile mean?
The 85th percentile means that 85% of items are completed within this time frame; they have a cycle time of this many days or less.
The accompanying commentary will flag outliers, and when a work item is hovered over in the commentary, it will be highlighted on the chart to make it easy to tie the two together.
How we define cycle time:
We define cycle time as the whole time a work item takes to traverse your boards workflow from left to right. We work with your individual boards workflow so cycle time is inherently contextual to your workflow on that board. Work items not completed are excluded, and cycle time is added when work items move back into your boards workflow one or many time.
Example insight:
"Our cycle times have improved significantly with a 49% decrease overall, bringing our median down to 3 days."
Throughput
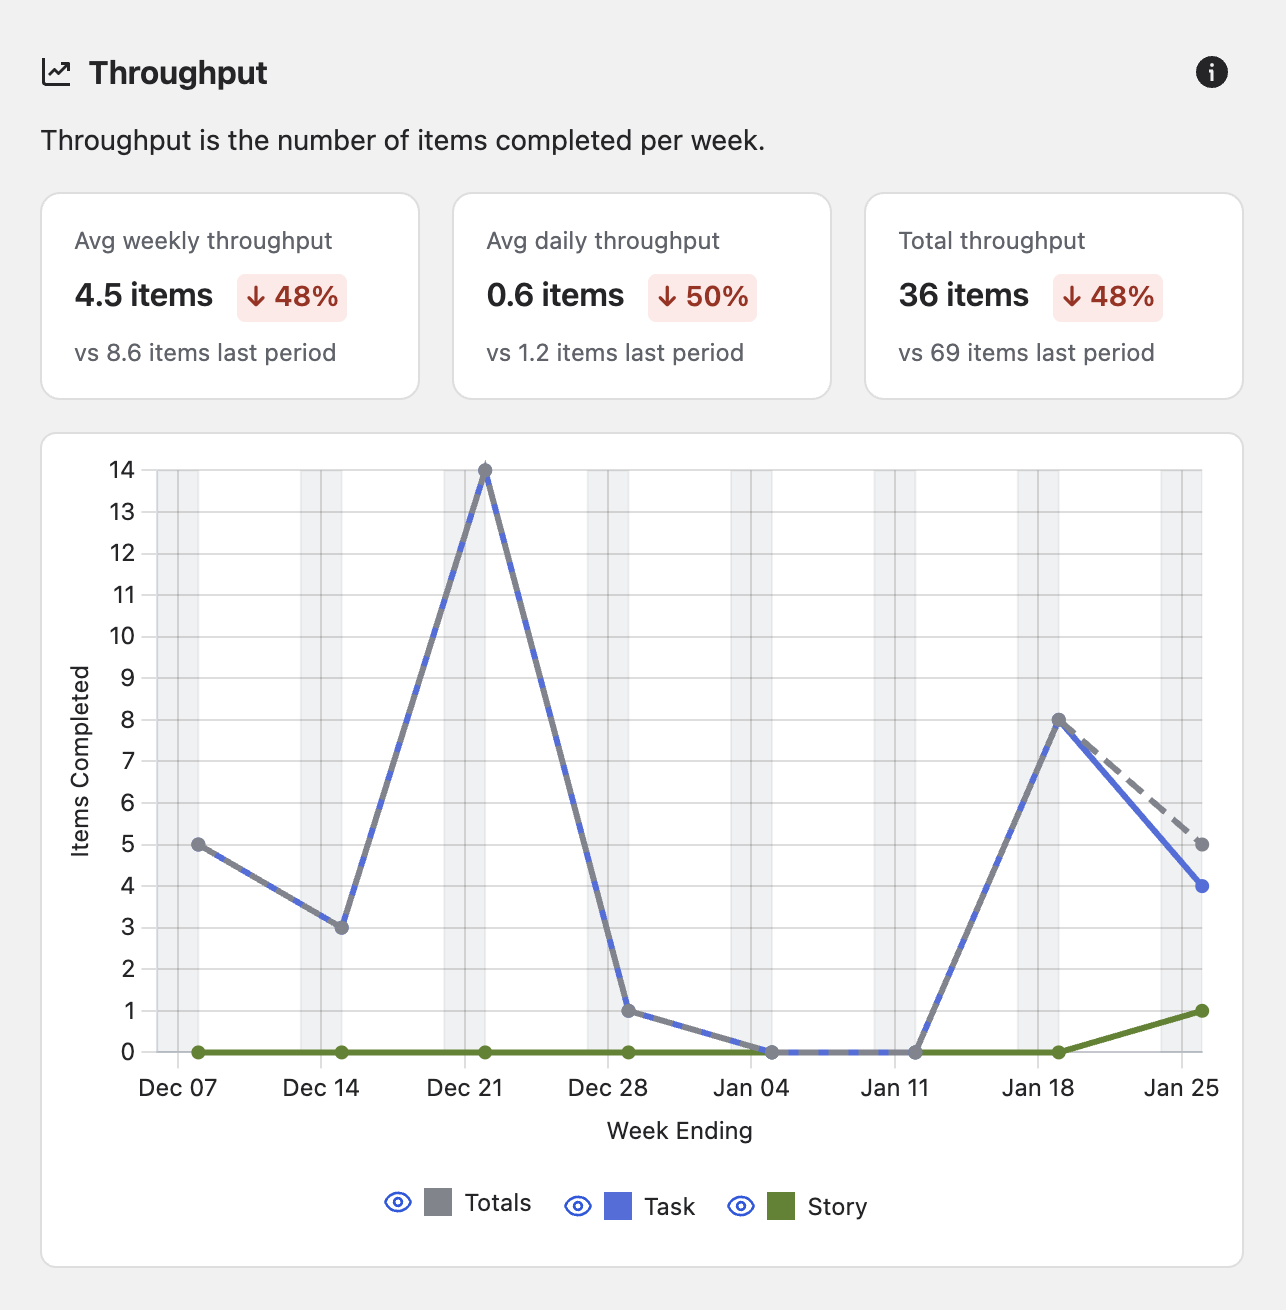
The throughput chart shows the number of items that complete your workflow each week over the time period selected. It provides an indication of whether the team is getting more or less work done over time and is worth correlating with the size of the team or other impacting factors such as holidays or changes in responsibilities.
Example insight:
"Throughput increased 15% compared to last quarter, but cycle time for stories remains high. Try breaking down large stories or reviewing blockers in your next retro."
Daily WIP by Age
This chart shows how much work the team has in progress in your workflow each day of the time period, and it segments this by the amount of time the work items have spent in the workflow.
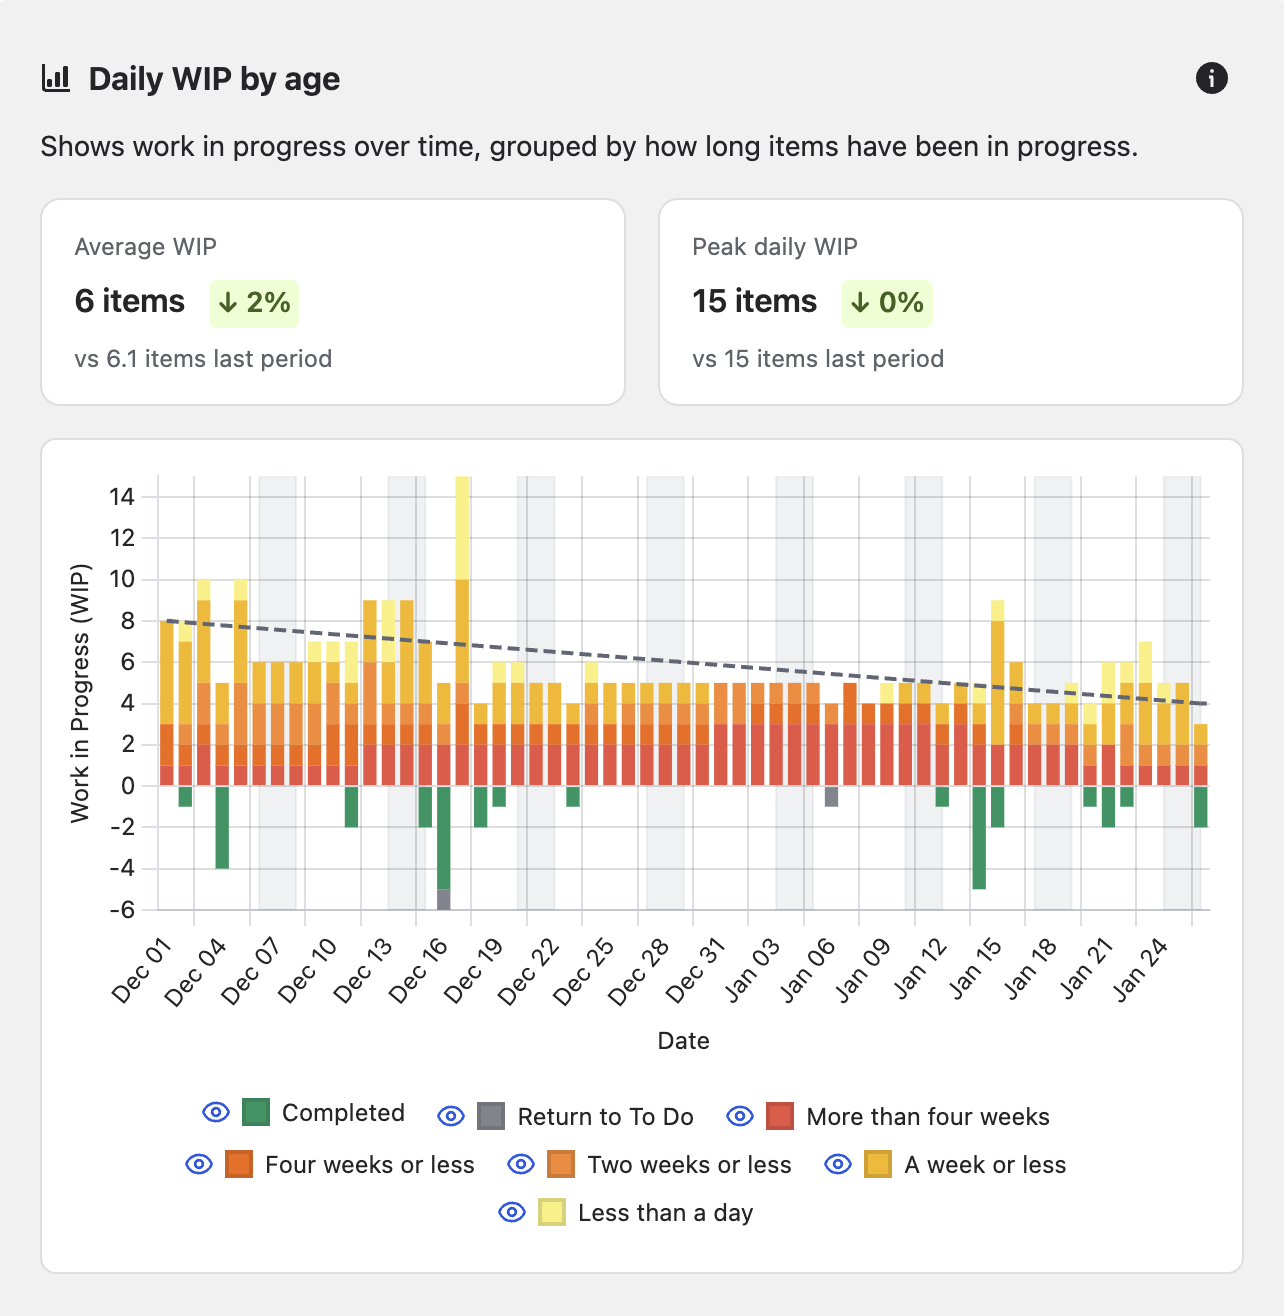
The chart uses colour coding to help you quickly identify:
-
Green: Completed items (returned to To Do)
-
Red: Items less than a day in progress
-
Orange: Items a week or less in progress
-
Yellow: Items two weeks or less in progress
-
Light yellow: Items four weeks or less in progress
Example insight:
"The concurrent work analysis shows 67% of team members working on multiple items simultaneously."
How to Use Team Insights
Work Item Keys
Hovering over a highlighted work item key in the analysis will identify where these items are plotted on the corresponding chart. The corresponding data point is enlarged on the chart, making it easy to tie the insight text to the visual data.
You can also hover over individual data points directly on the charts. When you hover over a dot on the scatterplot, a tooltip appears showing the work item key and summary, so you can quickly identify what each data point represents.
Click on a work item key in the insight text to open the work item details in a modal panel without leaving Team Insights. The detail panel displays the full work item information including description, subtasks, linked items, Confluence content, activity and comments, as well as a details pane showing status, components, assignee, reporter, labels, sprint, story points, and more. This enables deeper discussions with the team without losing context of the insight.
Filtering the Charts
Focus the charts by filtering the analysis period and work item types. This allows you to get a deeper understanding of specific time ranges or individual item types.
Learn more: See Filtering Team Insights for detailed information.
Copy Team Insights Link
You can share your Team Insights view with team members by copying a direct link. Click the link icon or share option to open the "Copy team insights link" dialog, which displays a URL you can copy and share with anyone who has access to the same board.
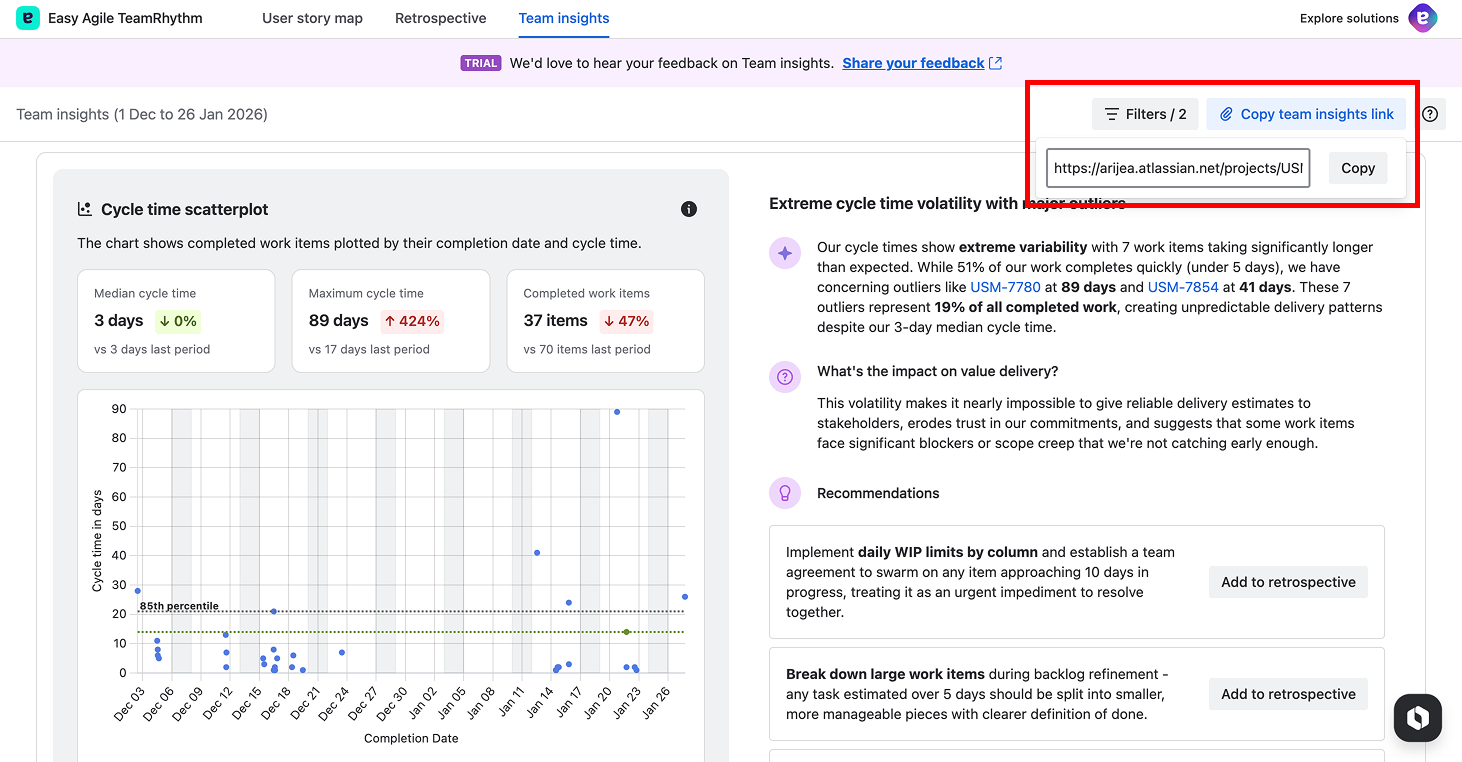
This is useful for sharing the analysis before a retrospective or team discussion so everyone can review the data and insights in advance.
Please note: to respect team member permissions on a board, a new insights report will generate for each user of the team. Shared team reports are coming soon.
Add to Retrospective
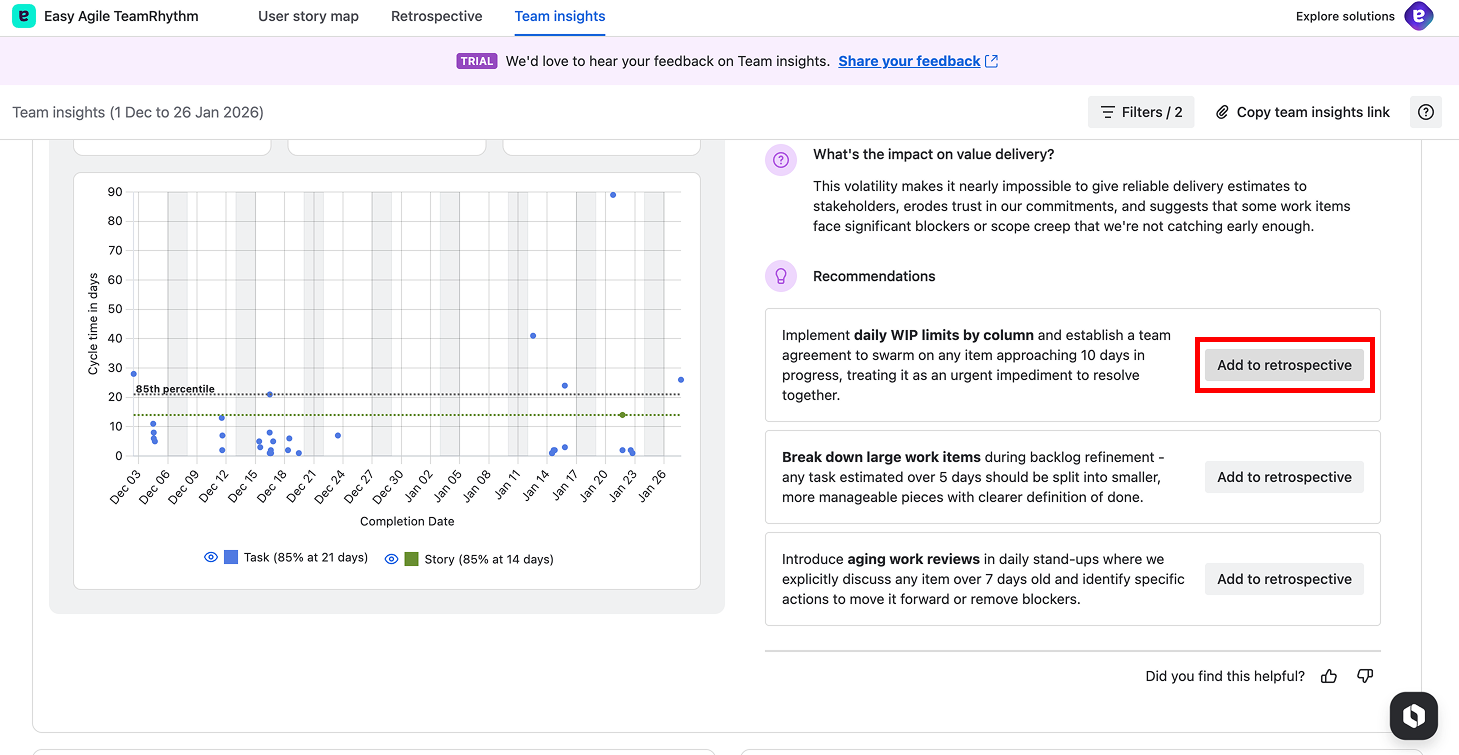
Each recommendation in Team Insights includes an "Add to retrospective" button, allowing you to capture insights directly into your team's retrospective. This creates a seamless workflow between reviewing data and planning improvements.
How to add a recommendation to a retrospective:
-
Click "Add to retrospective" on any recommendation in the insights panel.
-
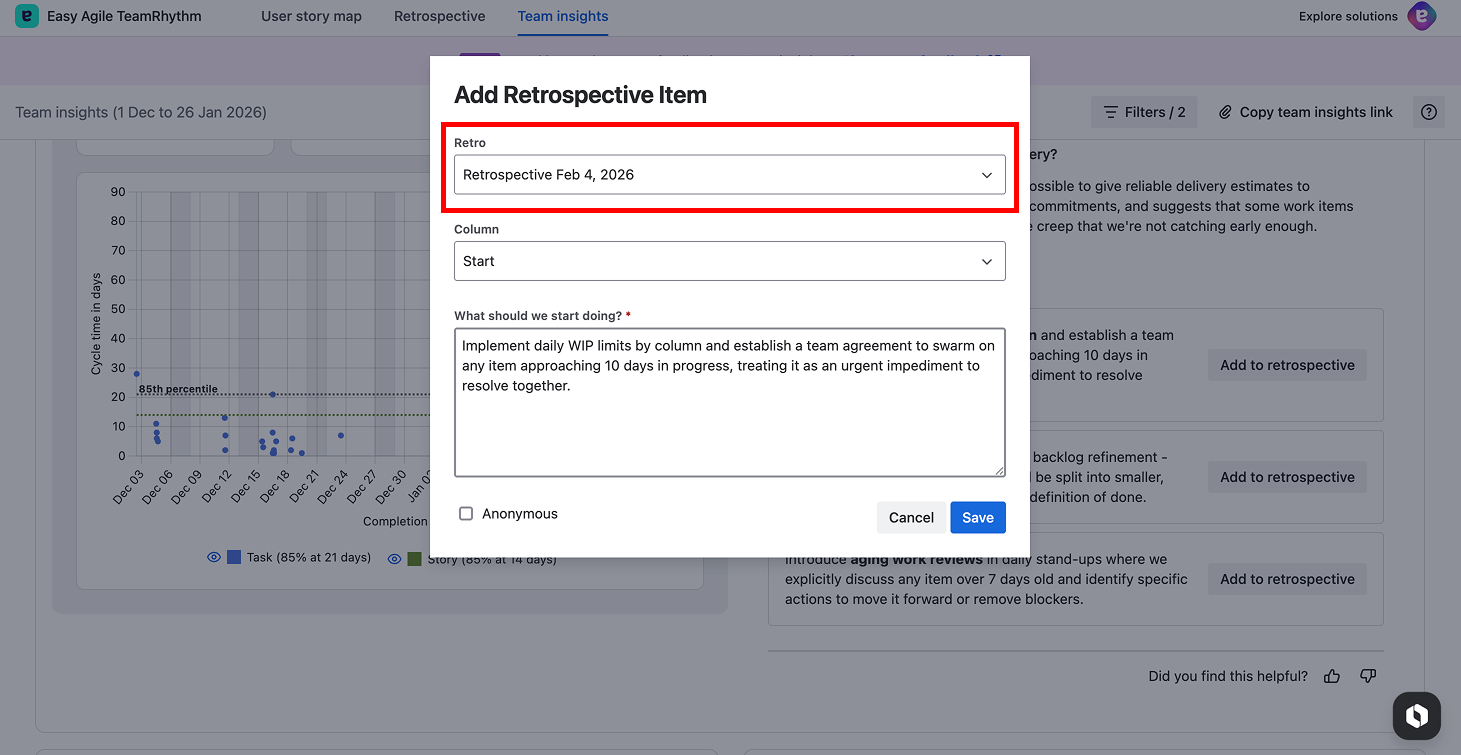
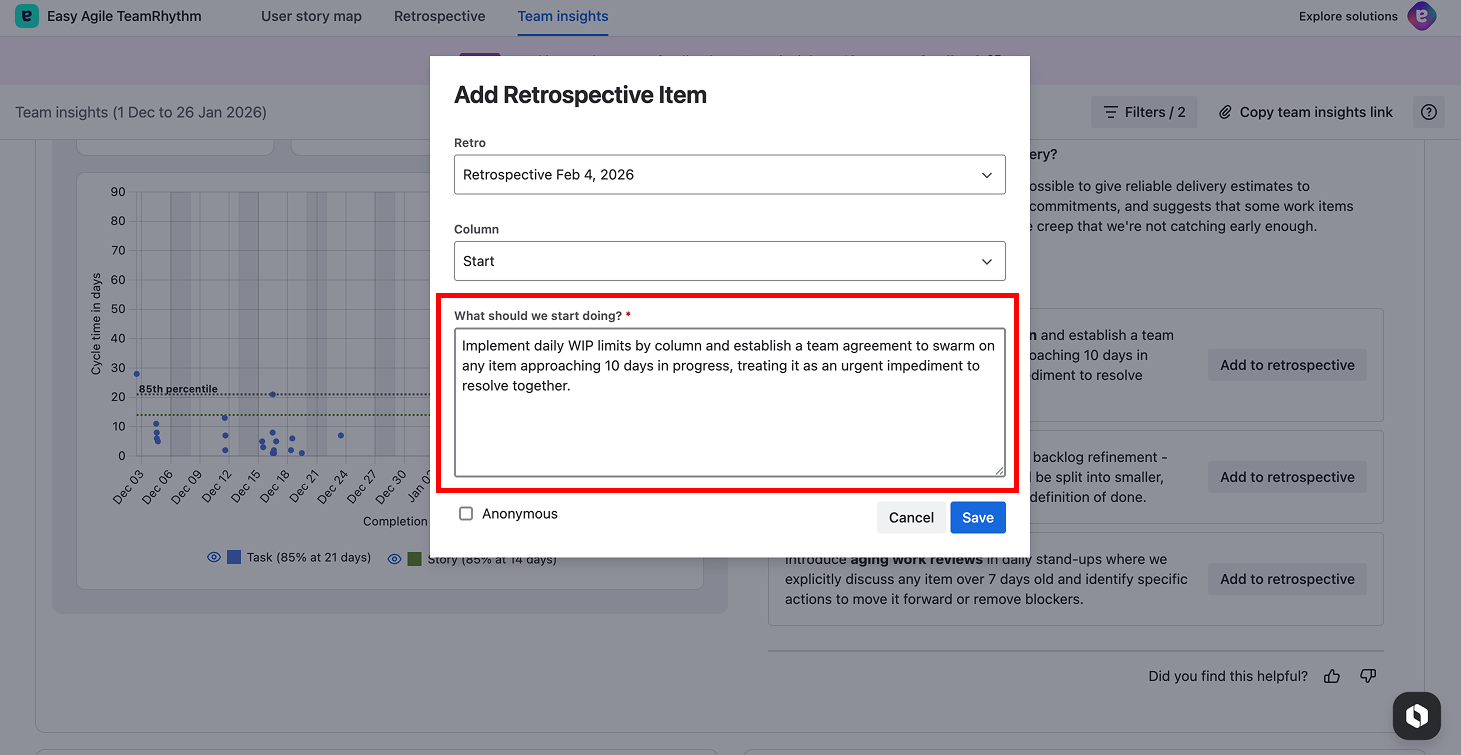
Select a retrospective: Choose from a dropdown list of available retrospectives, which displays past retros with their dates (e.g. "Retrospective Feb 4, 2026", "Retrospective Jan 27, 2026").
-
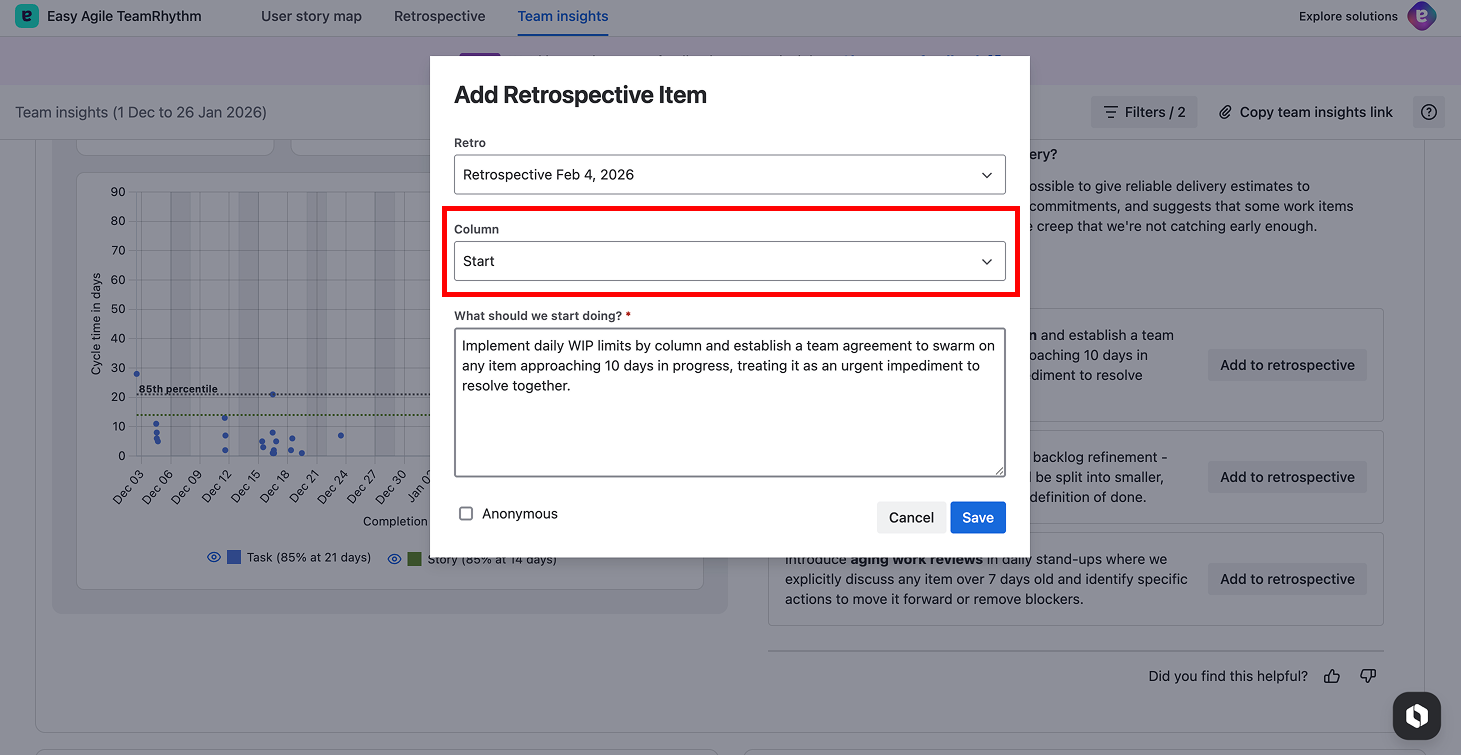
Select a column: Choose which retrospective column to add the item to — Start, Stop, Continue, or Comments.
-
Edit the text: The recommendation text is pre-populated from the insight, but you can edit it to add your own context or adjust the wording before saving.
-
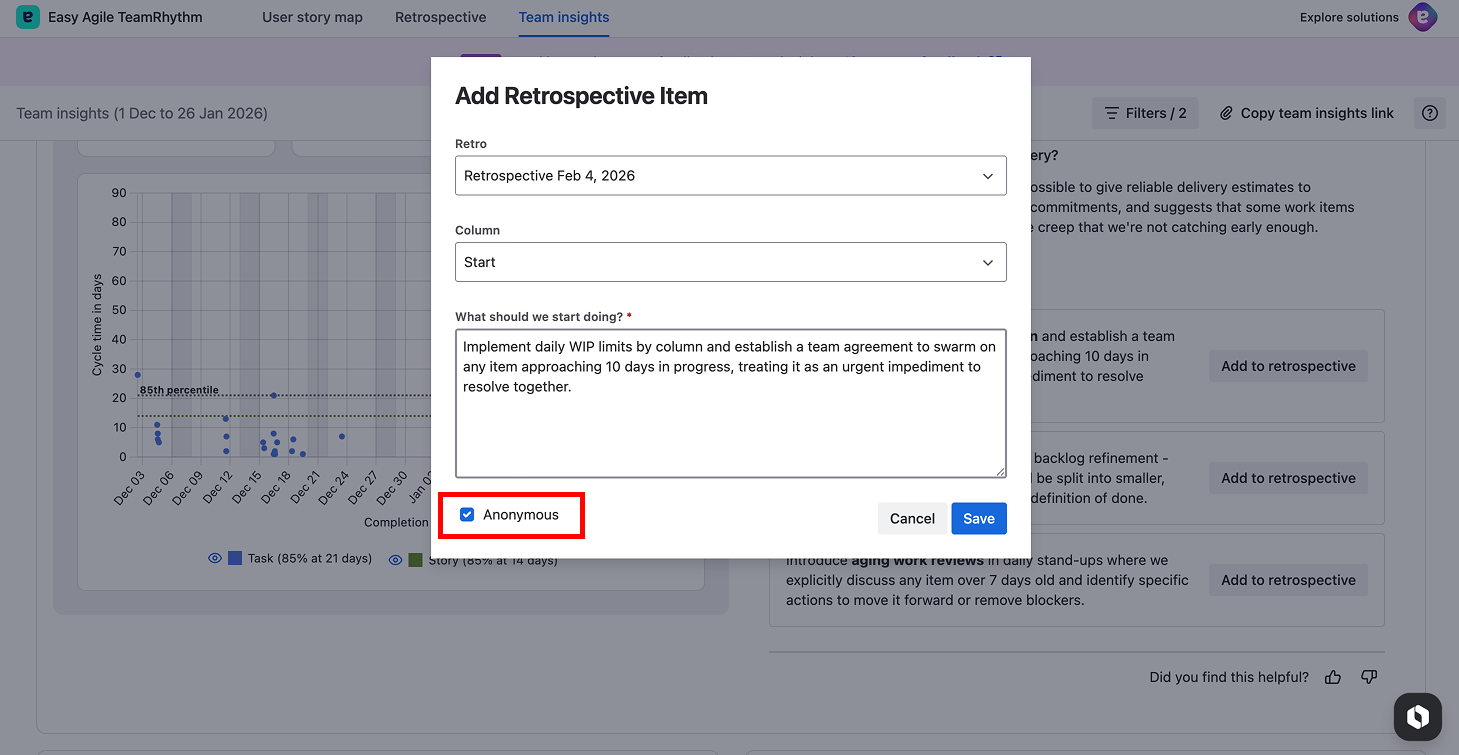
Post anonymously (optional): Tick the "Anonymous" checkbox if you'd like to post the item without your name attached. This can encourage more open and honest retrospective contributions.
-
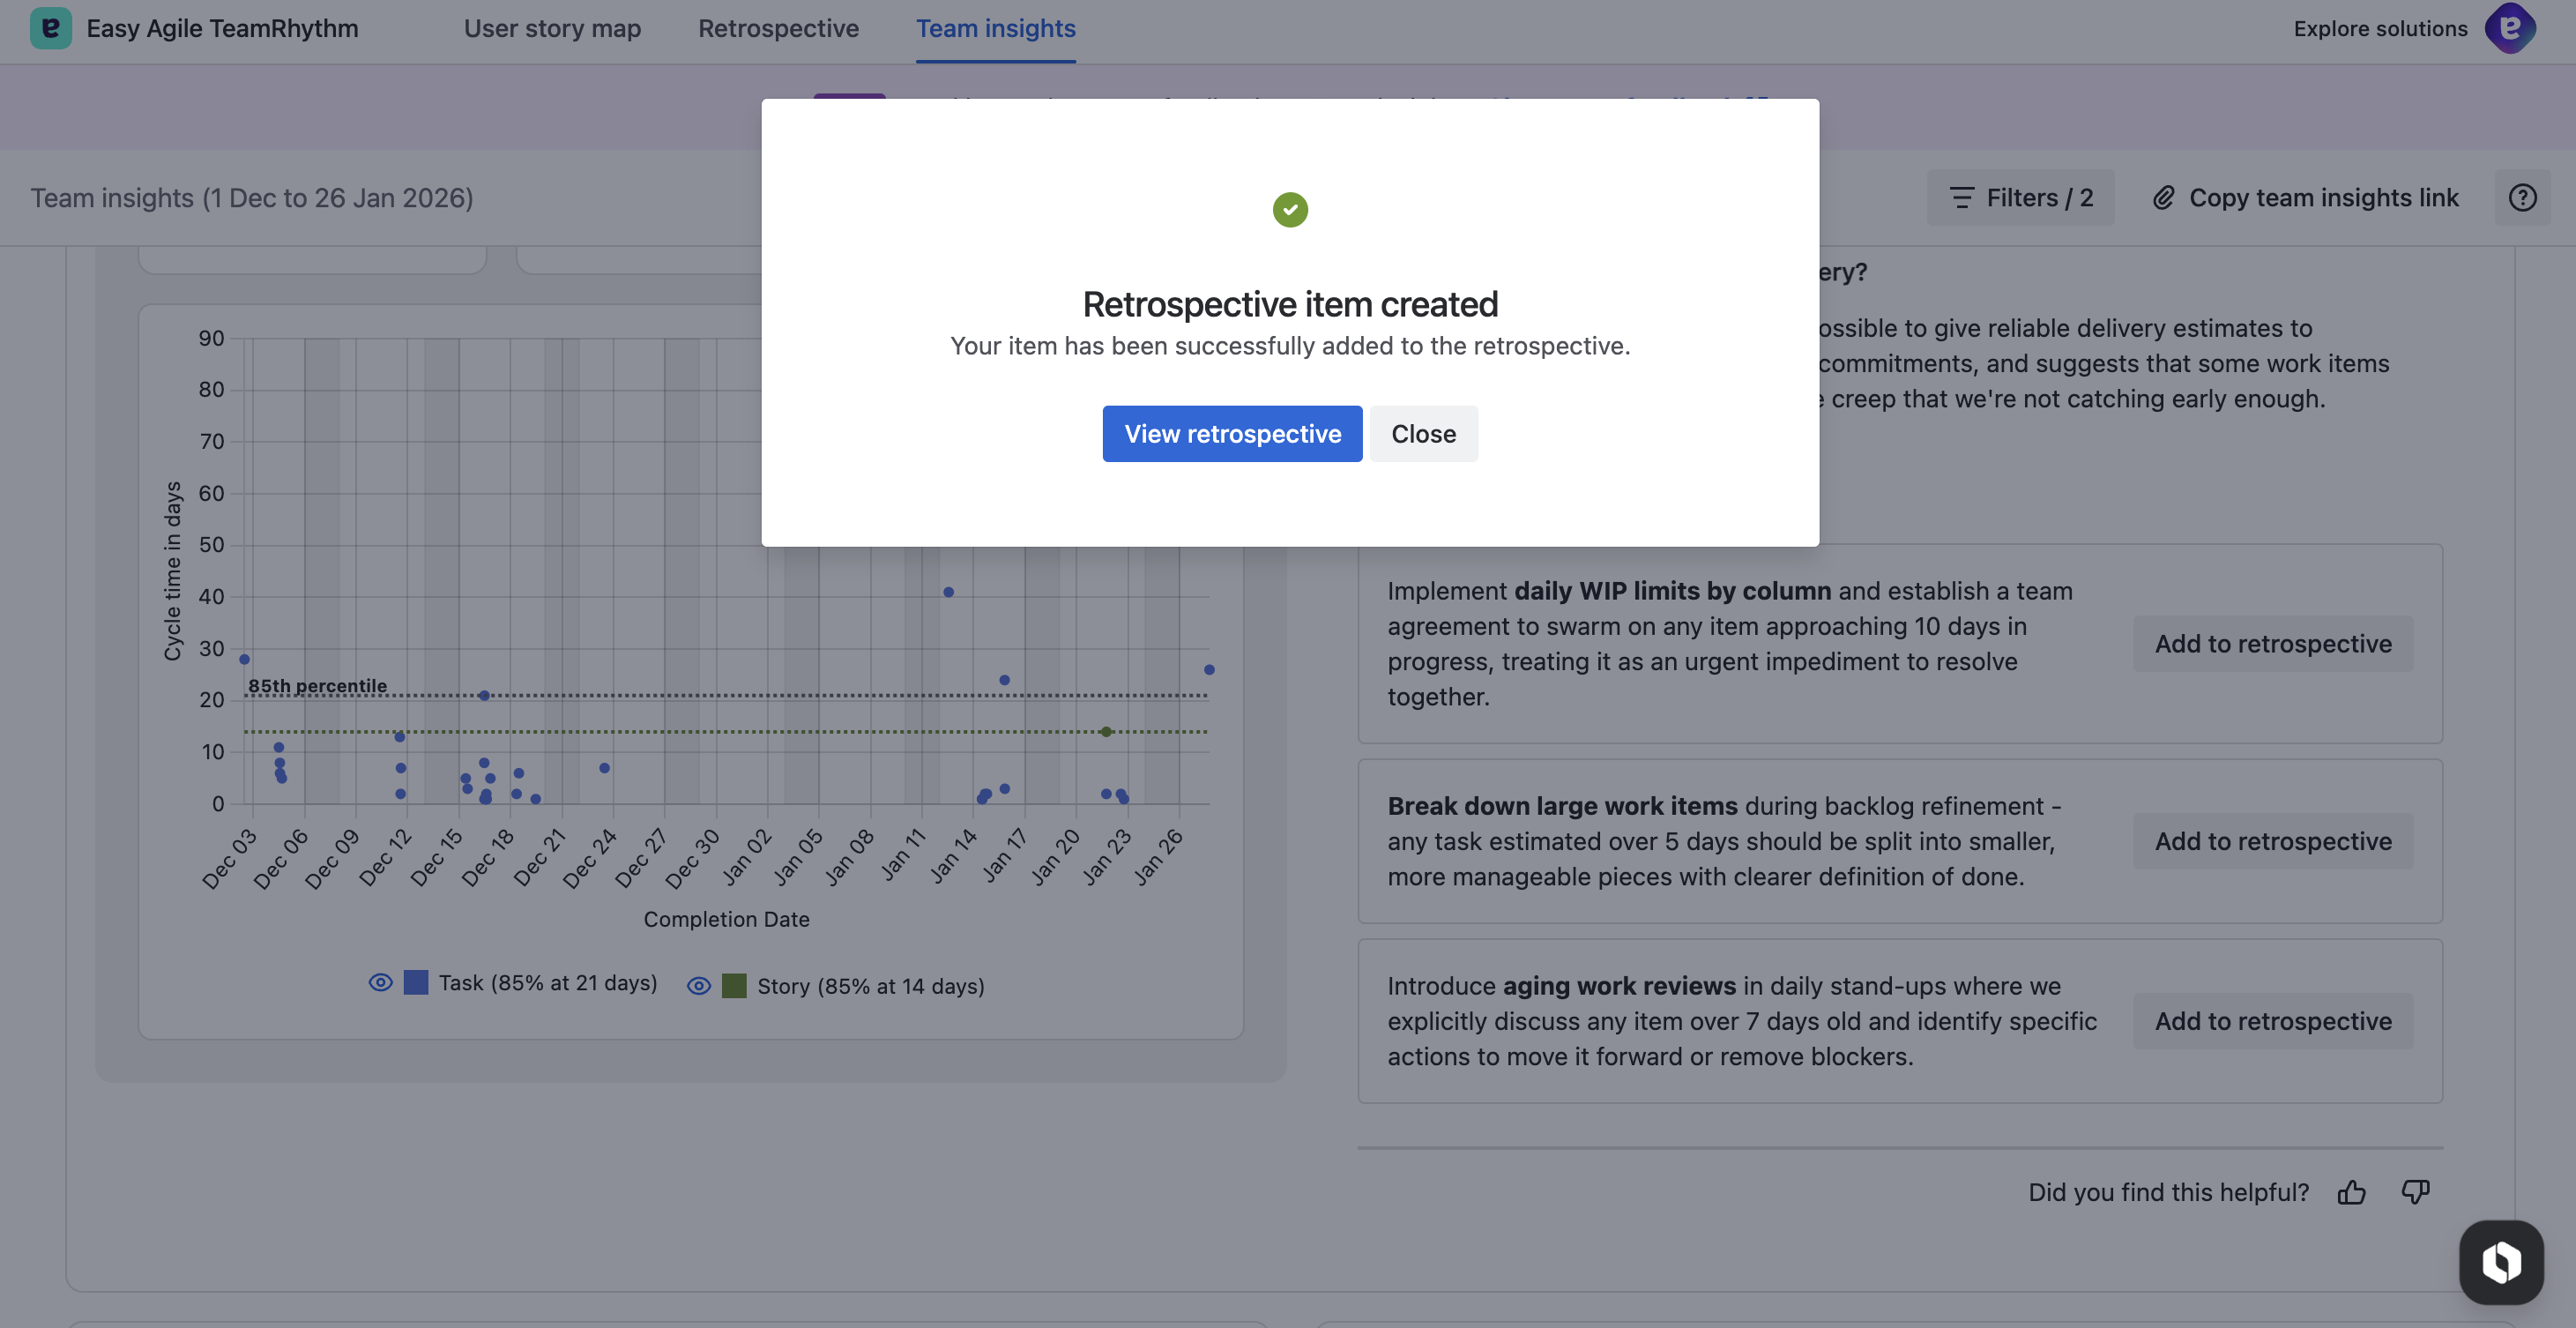
Save and confirm: Click "Save" to add the item. A confirmation dialog appears with a green checkmark confirming "Retrospective Item created" and giving you the option to "View retrospective" or "Close".
Feedback
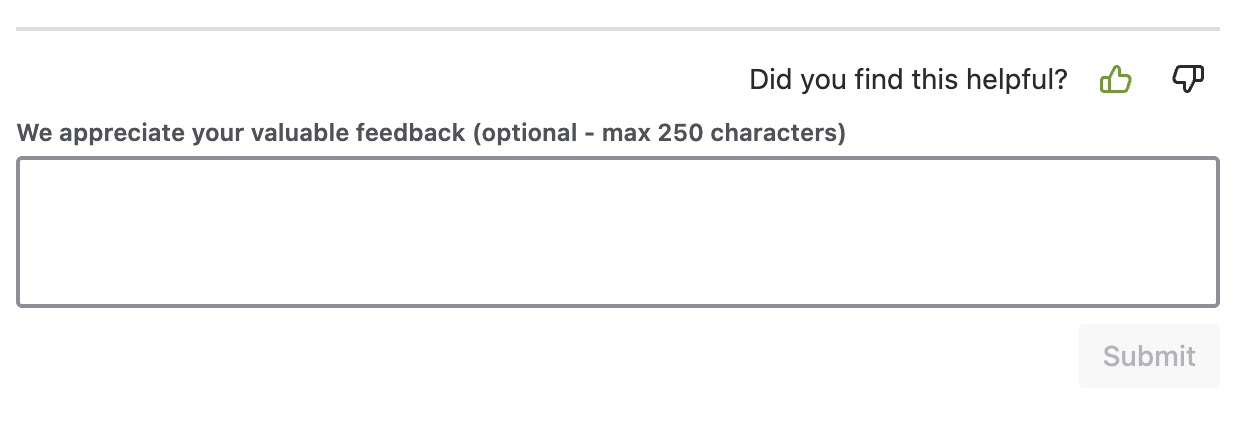
Help us continue to improve our reports by giving us feedback. The feedback panel appears at the bottom of the insights and includes a "Did you find this helpful?" prompt with reaction icons, as well as an optional text field where you can provide more detailed feedback (up to 250 characters). Click "Submit" to send your feedback.
Your feedback is fed back into our systems to continue to improve the quality and relevance of the analysis.