
Welcome to the Team Insights documentation. Team Insights provides your team with clear, actionable insights into your delivery health using your team's Jira data.
Documentation Structure
This documentation follows a hierarchical structure to help you find information quickly:
Getting Started
-
-
What is Team Insights?
-
Why use Team Insights?
-
How to access Team Insights
-
Core Concepts
-
-
How Team Insights works
-
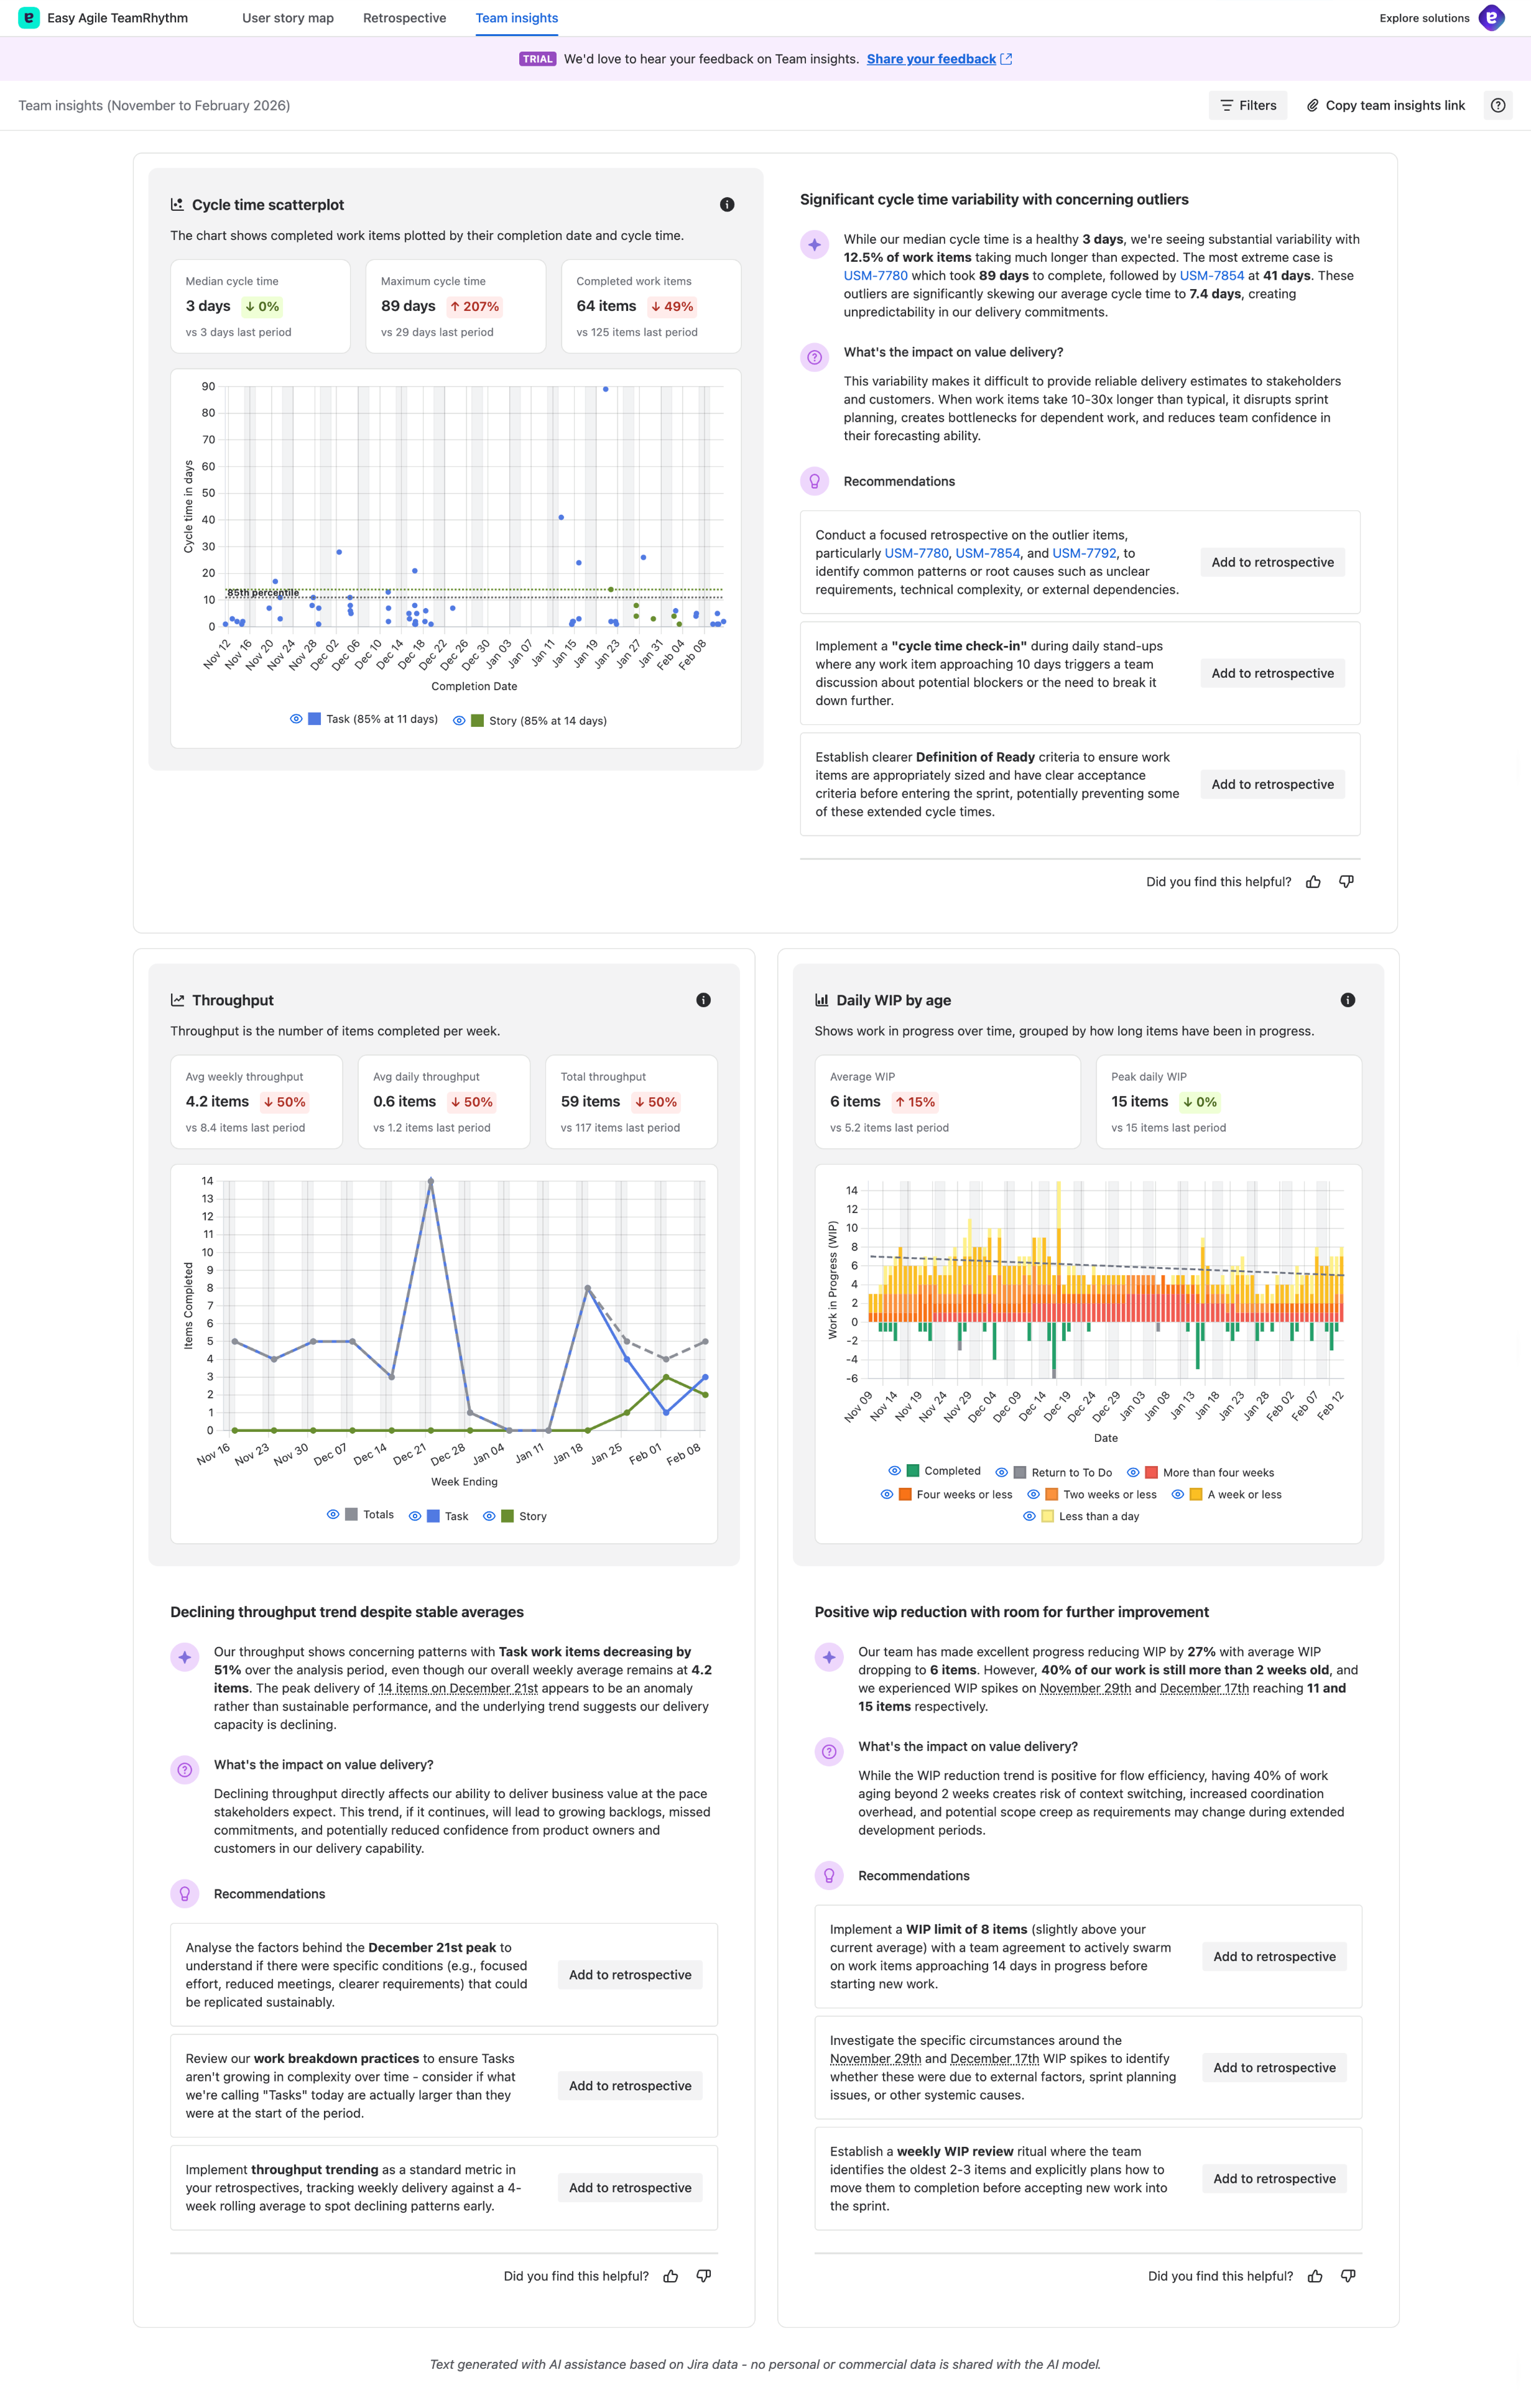
Key components (Celebration, Cycle Time Scatterplot, Throughput, Daily WIP by Age)
-
How to use Team Insights (work item keys, chart hover, copy link, add to retrospective, feedback)
-
-
-
Accessing filters
-
Analysis period filtering
-
Work item type filtering
-
Applying and clearing filters
-
Understanding filtered results
-
Tips for effective filtering
-
-
-
Chart legend filtering (toggle work item type visibility)
-
Cycle Time Scatterplot (comparison metrics, interactive features)
-
Throughput chart
-
Daily WIP by Age chart
-
Interacting with insights (insight card structure, definition tooltips)
-
Tips for chart analysis
-
Reference
-
-
How your data is protected
-
What data is sent (and what isn't)
-
Compliance and security
-
Data retention
-
-
Best Practices & Tips - coming soon
-
Using Team Insights in team rituals
-
Data quality best practices
-
Interpreting insights
-
Getting started guide
-
Advanced tips
-
-
Troubleshooting & FAQs - coming soon
-
Common questions
-
Data and accuracy issues
-
Filtering questions
-
Technical issues
-
Feature questions
-
Quick Links
Common Tasks
-
Use Team Insights in retrospectives - coming soon
-
Interpret high cycle times - coming soon
Getting Help - coming soon
-
Why does my report look different from my colleague's?
-
Why does my report look off?
-
Team Insights won't load
-
Can I export Team Insights?
-
Is my data secure?
What's New
Latest Updates:
-
Filtering functionality: Filter Team Insights by analysis period and work item types
-
Enhanced chart interactions: Hover over data points to see work item key and summary; hover over work item keys in insights to highlight them on charts
-
Work item detail panel: Click work item keys to view full details in a modal panel without leaving Team Insights
-
Structured insight cards: Insights now include a clear metric headline, observation, impact on value delivery, and actionable recommendations
-
Definition tooltips: Hover over key terms to see explanations of metrics and terminology
-
Add to retrospective workflow: Capture recommendations directly into specific retrospectives, with column selection (Start, Stop, Continue, Comments) and anonymous posting option
-
Copy Team Insights link: Share a direct link to your Team Insights view with team members
-
Improved feedback panel: Provide detailed feedback (up to 250 characters) with reaction icons to help us improve the analysis
-
Comparison metrics: Each key metric now shows a comparison to the previous period with directional arrows and percentage changes
Feedback
Help us improve this documentation:
-
Found something unclear? Let us know what could be better
-
Found an error? Report it so we can fix it
-
Have a suggestion? Share your ideas for new content
Use the feedback link at the top of any documentation page or contact Easy Agile support.
Next Steps
New to Team Insights? Start with Team Insights Overview
Ready to dive deeper? Explore Understanding Team Insights
Want to use filtering? Read Filtering Team Insights
Looking for tips? Check out Best Practices & Tips
Need help? Visit Troubleshooting & FAQs