
Delivery Insights
Delivery Insights helps you understand if your program is on track by surfacing patterns across multiple teams. You get a consolidated view of cycle time, throughput, and work in progress with recommendations.
Delivery Insights is available on Jira Cloud only.
Why use Delivery Insights?
Delivery Insights helps delivery leaders maintain delivery predictability and stakeholder confidence:
-
Understand cross-team patterns: See which teams are struggling and whether issues are systemic or isolated
-
Communicate with confidence: Use evidence to support your stakeholder updates
-
Spot issues early: Identify coordination problems before they become blockers
-
Make informed decisions: Get specific recommendations on what to investigate or monitor
How to access Delivery Insights
-
Open Easy Agile Programs in your Jira site
-
Navigate to Reports from the top navigation
-
Select Delivery Insights from the tabs
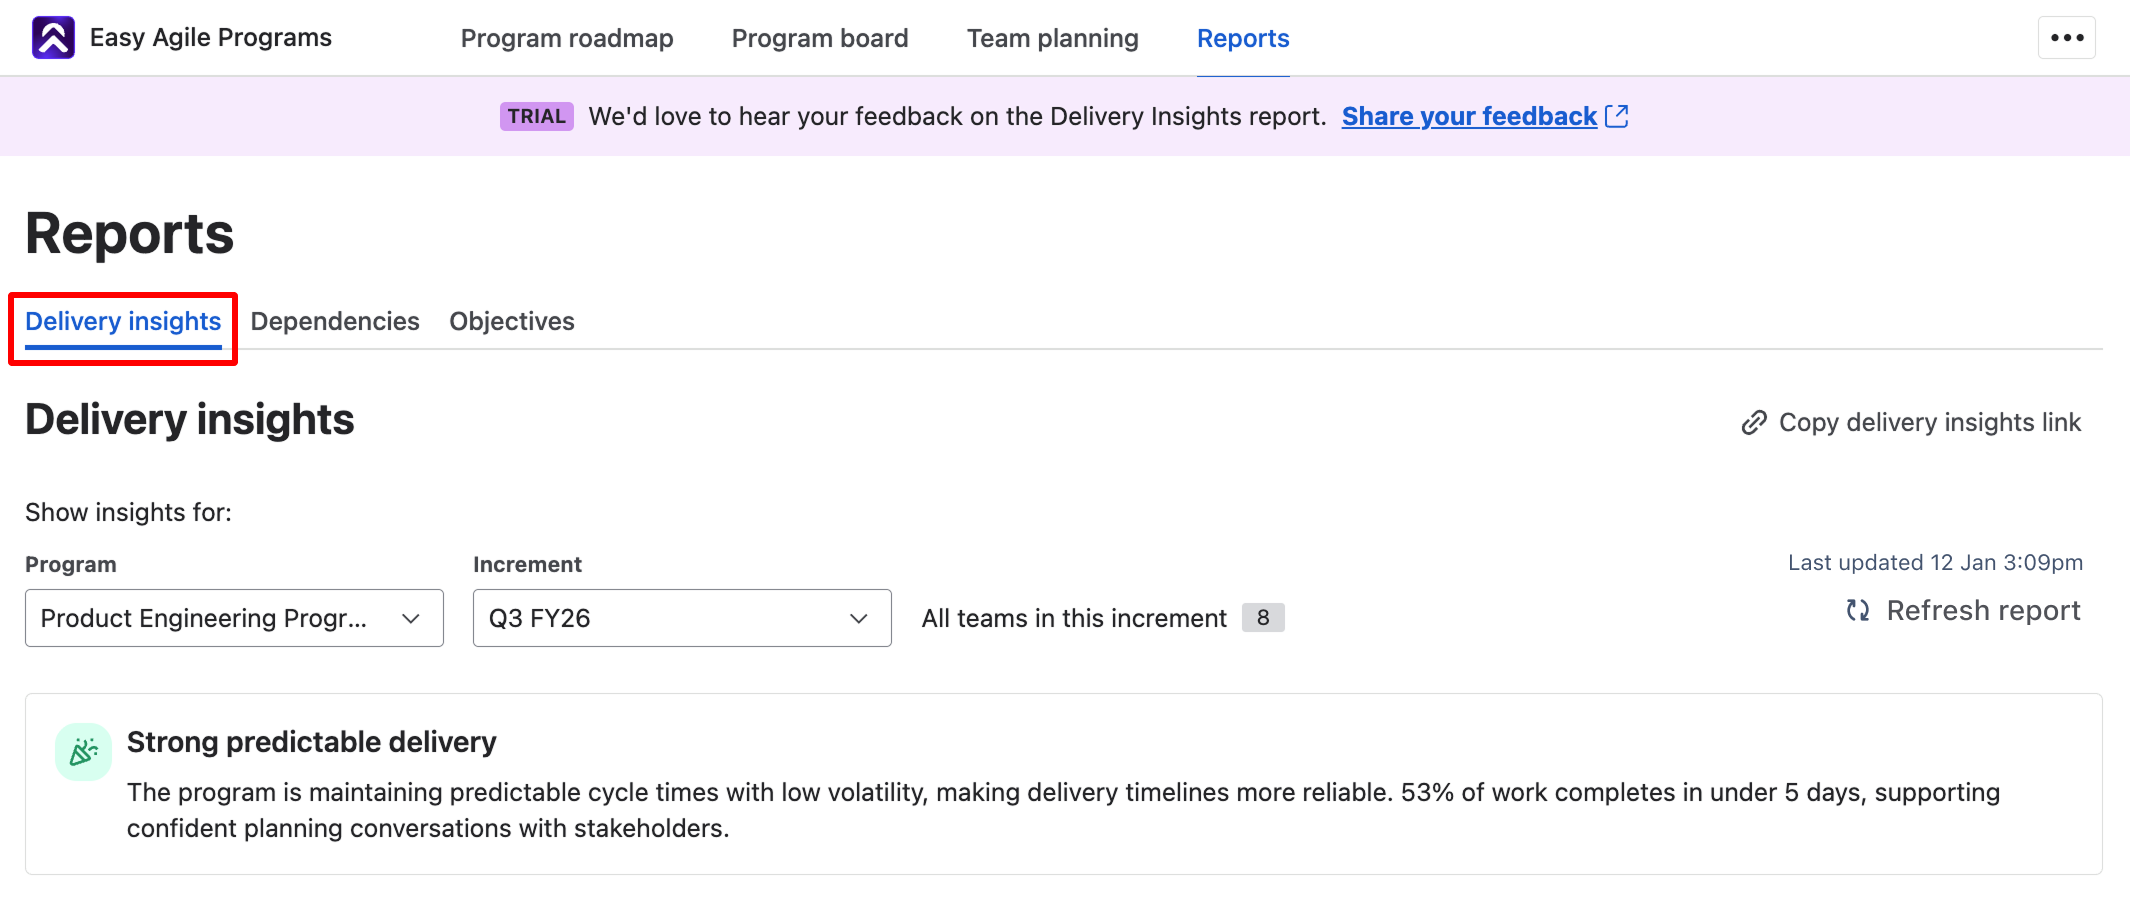
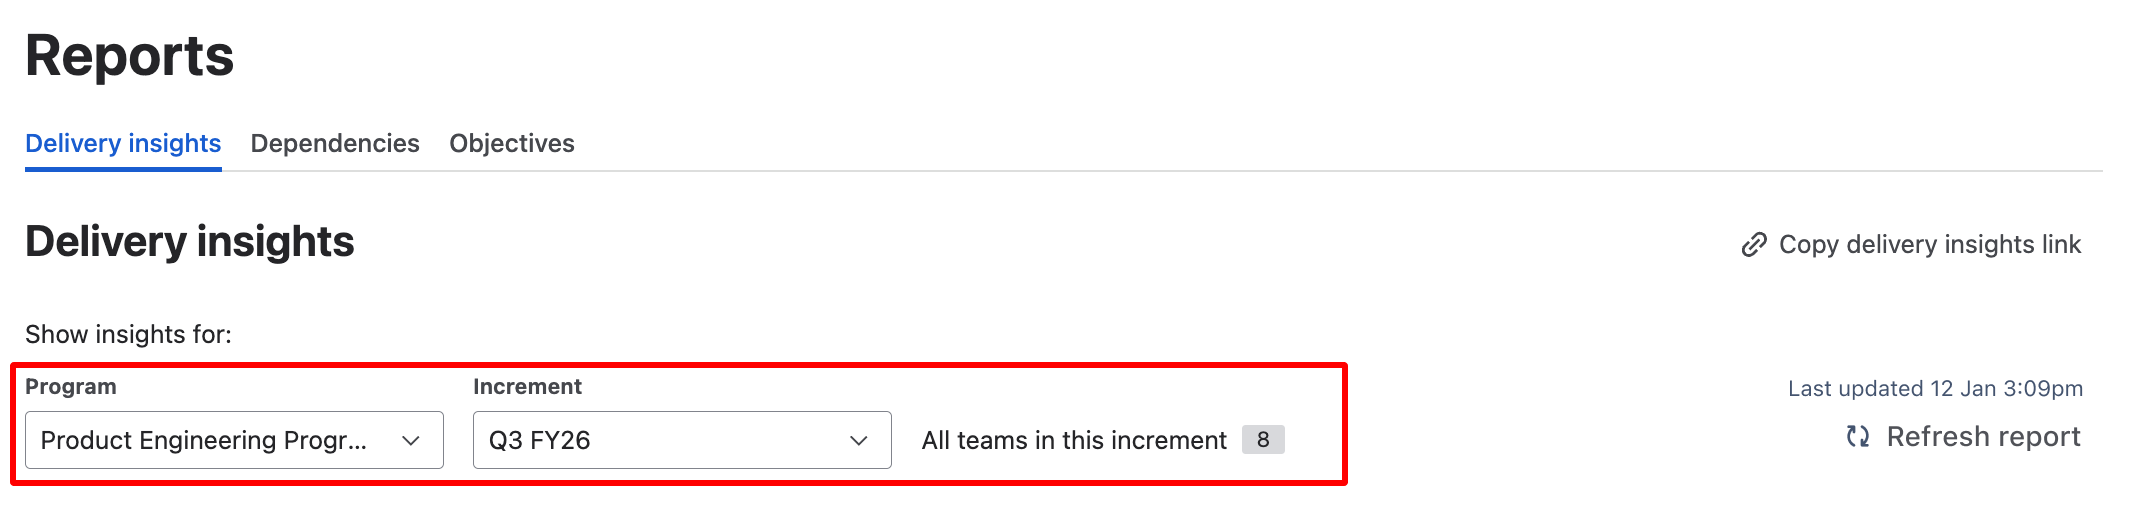
You can filter the report by selecting a Program and Increment from the dropdowns at the top of the page. The report shows data for all teams in the selected program that you have permission to view in Jira.
Key components of Delivery Insights
The report analyses three key metrics that help you understand program delivery health: cycle time, throughput, and work in progress.
For each metric, you'll see observations about what the data shows, the impact on your program's delivery confidence, and specific recommendations for what to investigate or monitor.
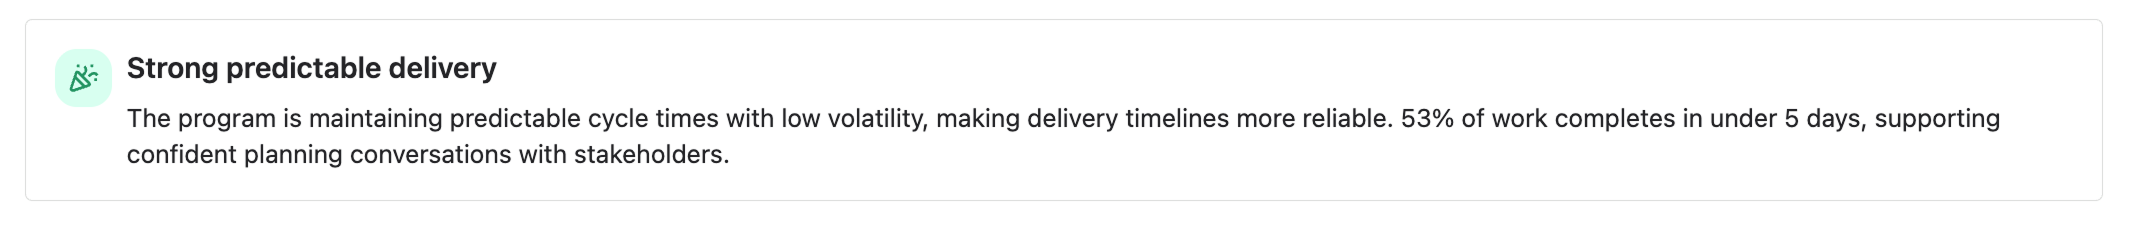
Celebration
When your program shows particularly strong delivery patterns, you'll see a celebration at the top of the report. This might recognise predictable delivery, improving trends, or consistently fast completion times.
Celebrations don't appear on every report - they surface when the data shows meaningful positive patterns worth acknowledging with your teams.
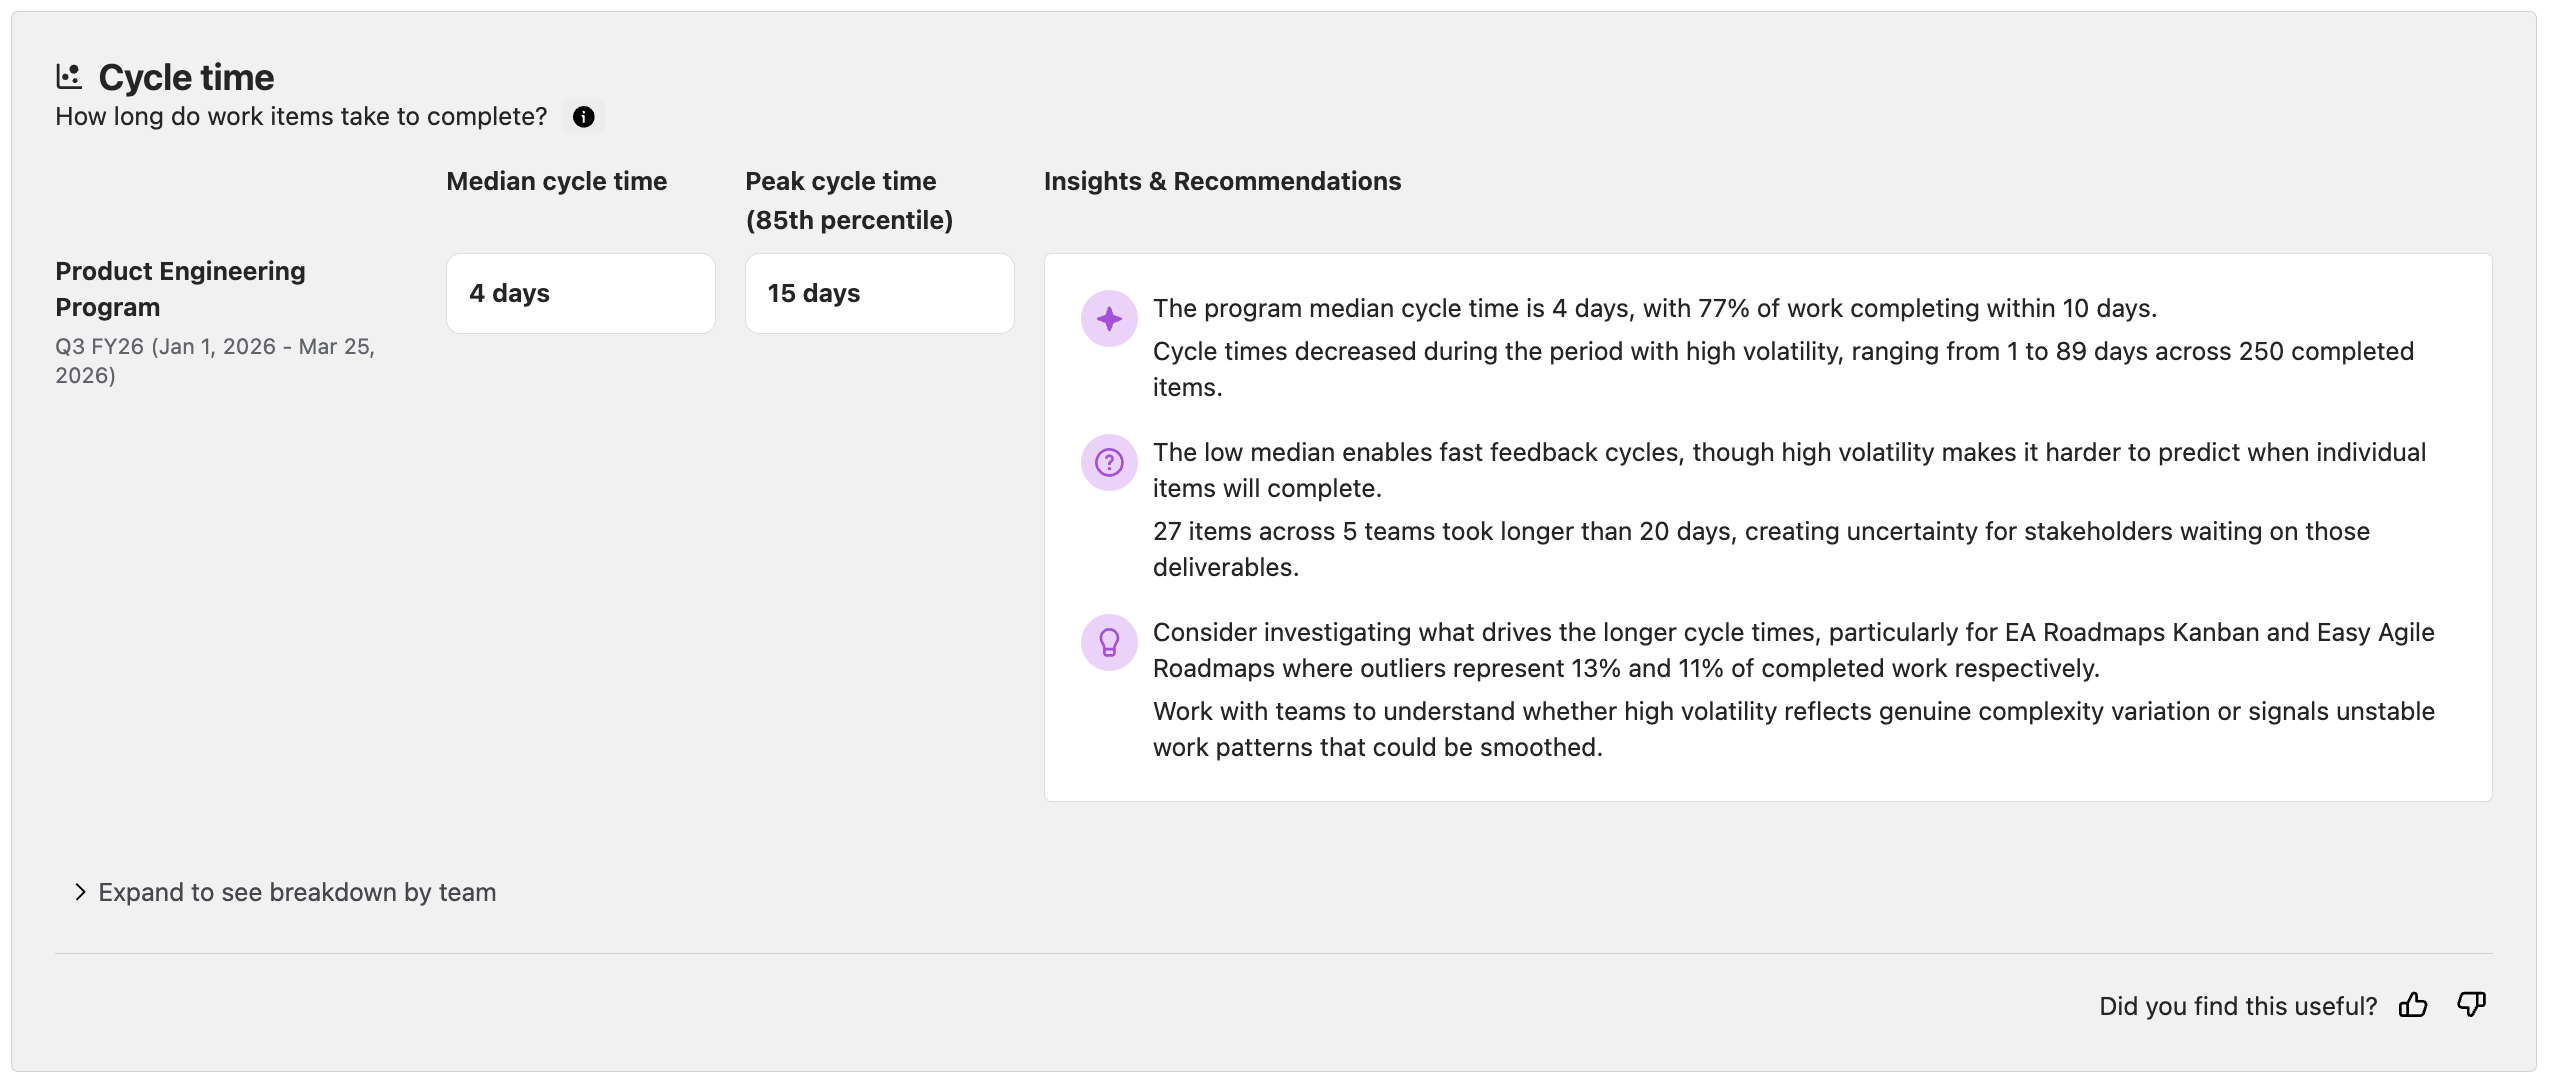
Cycle Time: How Long Does Work Take?
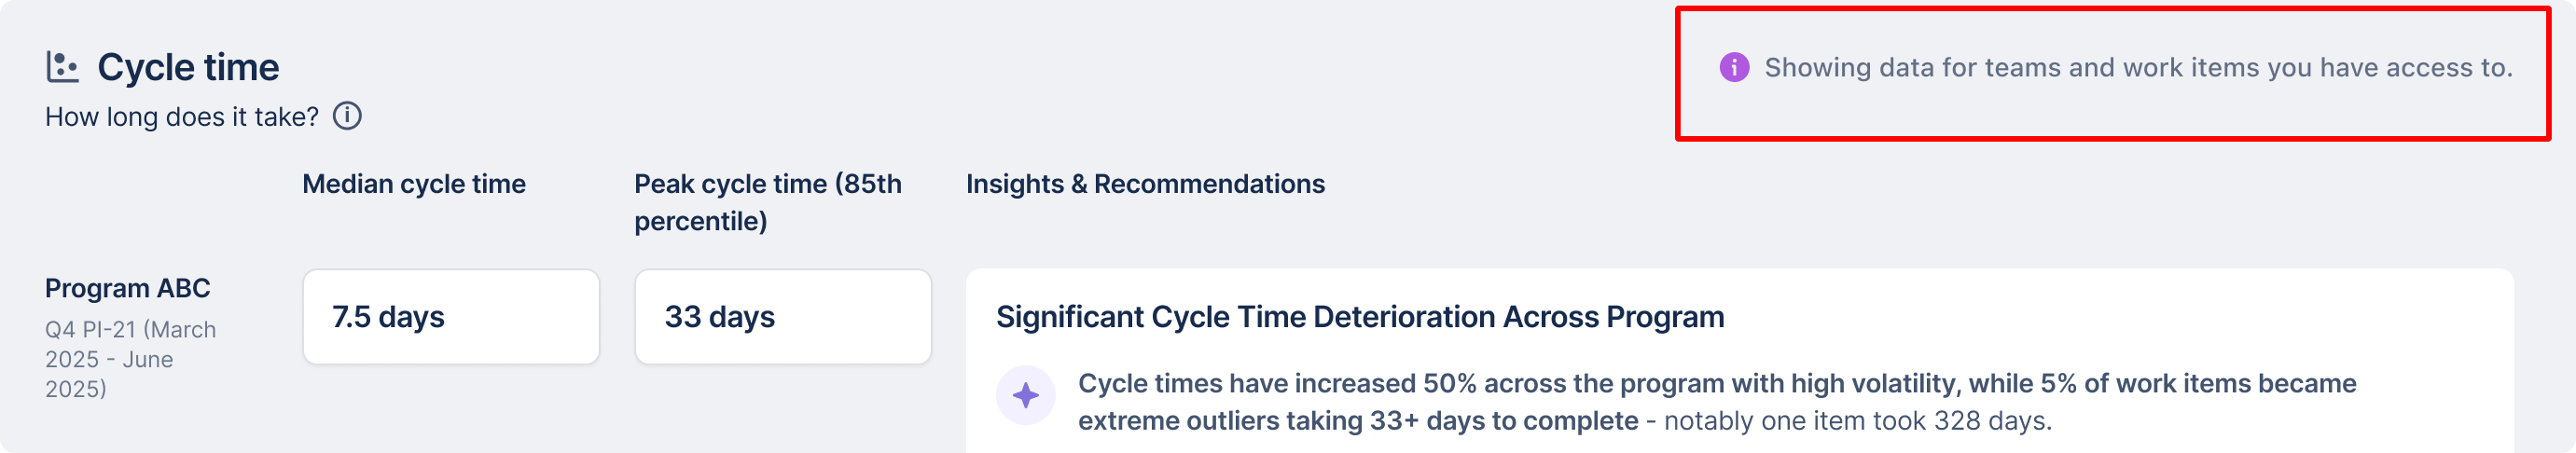
Cycle time measures how long work items take to complete from the moment they start to when they're done. The report shows two key numbers: median cycle time (the typical completion time) and peak cycle time at the 85th percentile (accounting for items that take longer than usual).
What does 85th percentile mean?
The 85th percentile means that 85% of items are completed within this time frame; they have a cycle time of this many days or less.
How we define cycle time:
We define cycle time as the whole time a work item has spent in an In Progress status category. This is inherently contextual to your teams' workflow configuration in Jira.
What the insights tell you:
The insights help you understand whether your program can deliver predictably. Stable cycle times with low variation suggest you can commit to timelines with confidence. High variation or increasing trends signal that delivery timelines are becoming less predictable, which affects stakeholder confidence and planning accuracy.
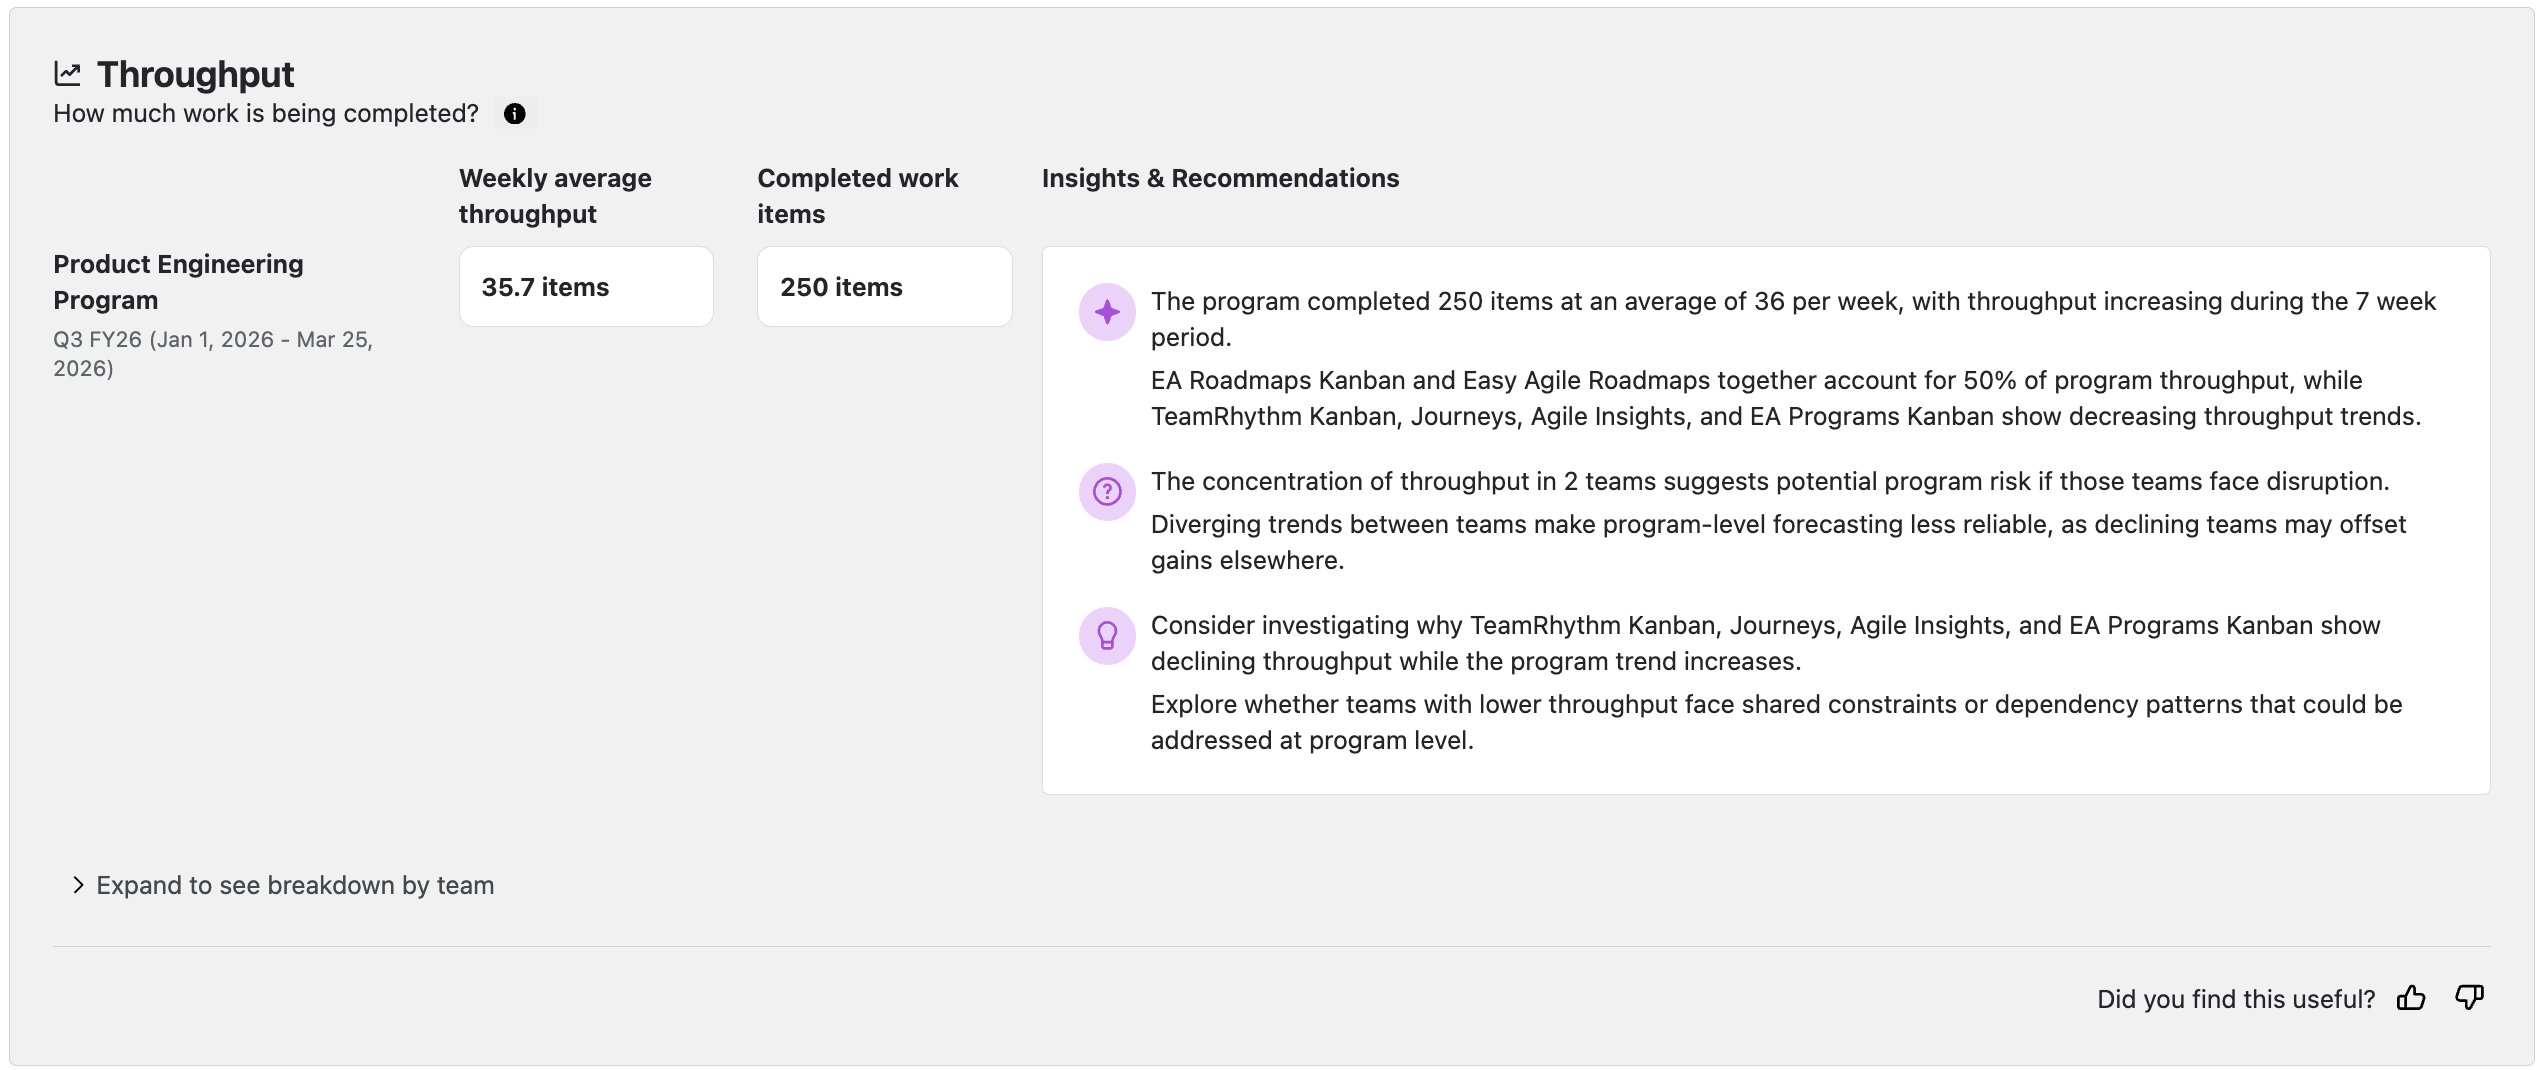
Throughput: How Much Work Gets Completed?
Throughput measures how much work your program completes. You'll see the weekly average throughput (how many items complete per week on average) and the total completed work items for the period.
What the insights tell you:
This metric helps you gauge whether the program has the capacity to deliver on commitments. Increasing throughput suggests the program is building momentum, while declining throughput may indicate teams are facing obstacles or that work is more complex than expected.
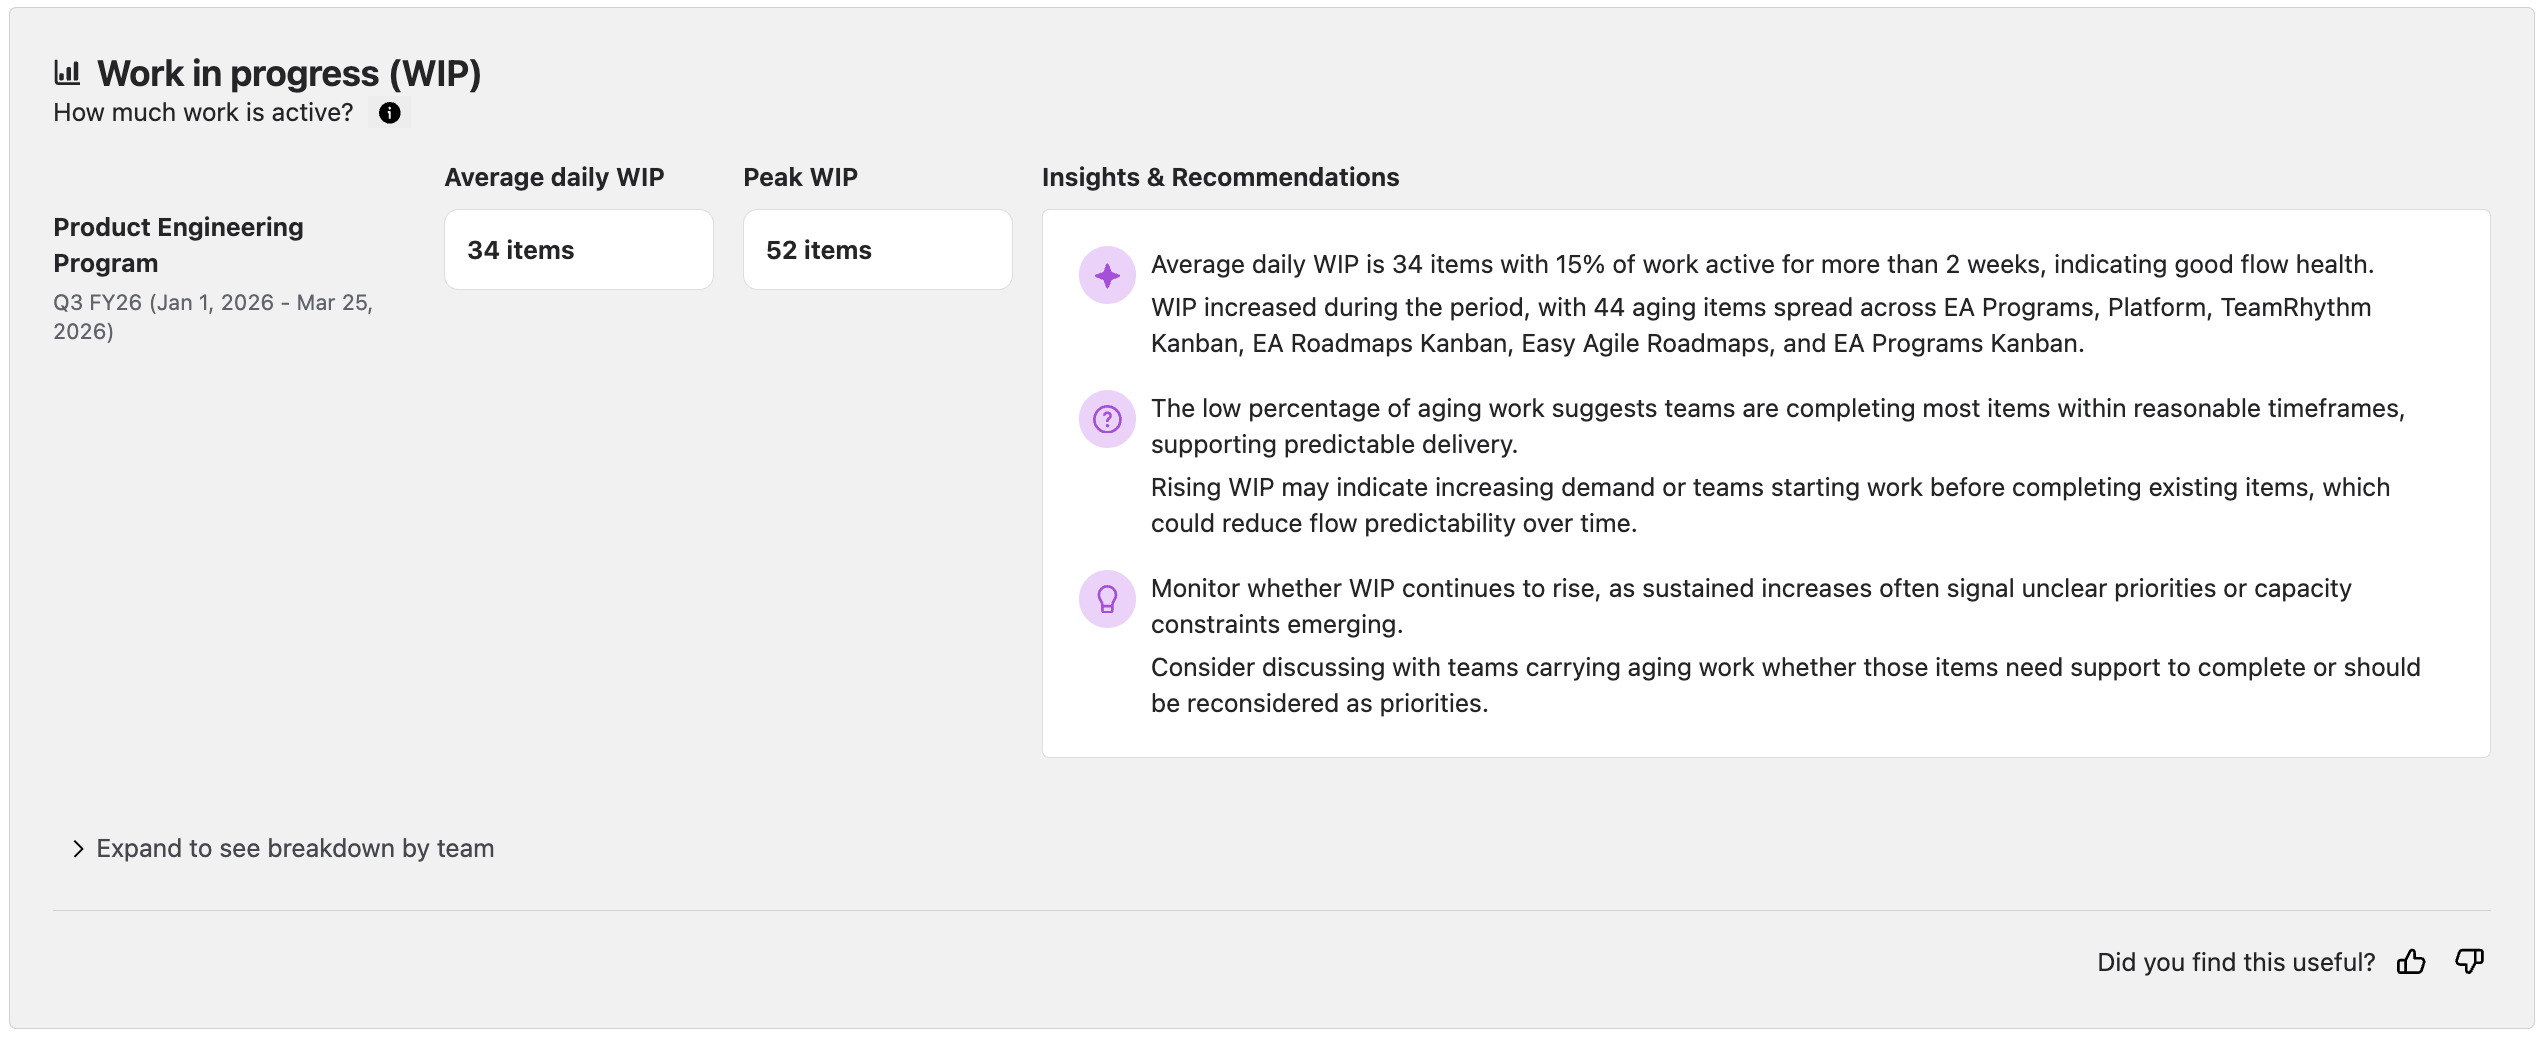
Work in Progress: How Much Work Is Active?
Work in progress (WIP) shows how many items are actively being worked on across your program. The report displays average daily WIP and peak WIP with insights about the age of work items across the program.
What the insights tell you:
High WIP often signals that teams are juggling too much concurrent work, which can slow delivery and reduce predictability. The percentage of aging work helps you spot items that might be stuck or blocked. Lower WIP with few aging items typically indicates healthier flow and more predictable delivery.
How to use Delivery Insights
Refresh report
The report refreshes automatically every 7 days to ensure everyone in your program refers to the same data during sync meetings and stakeholder updates. If you need to see the latest data sooner, click Refresh report at the top right of the page.
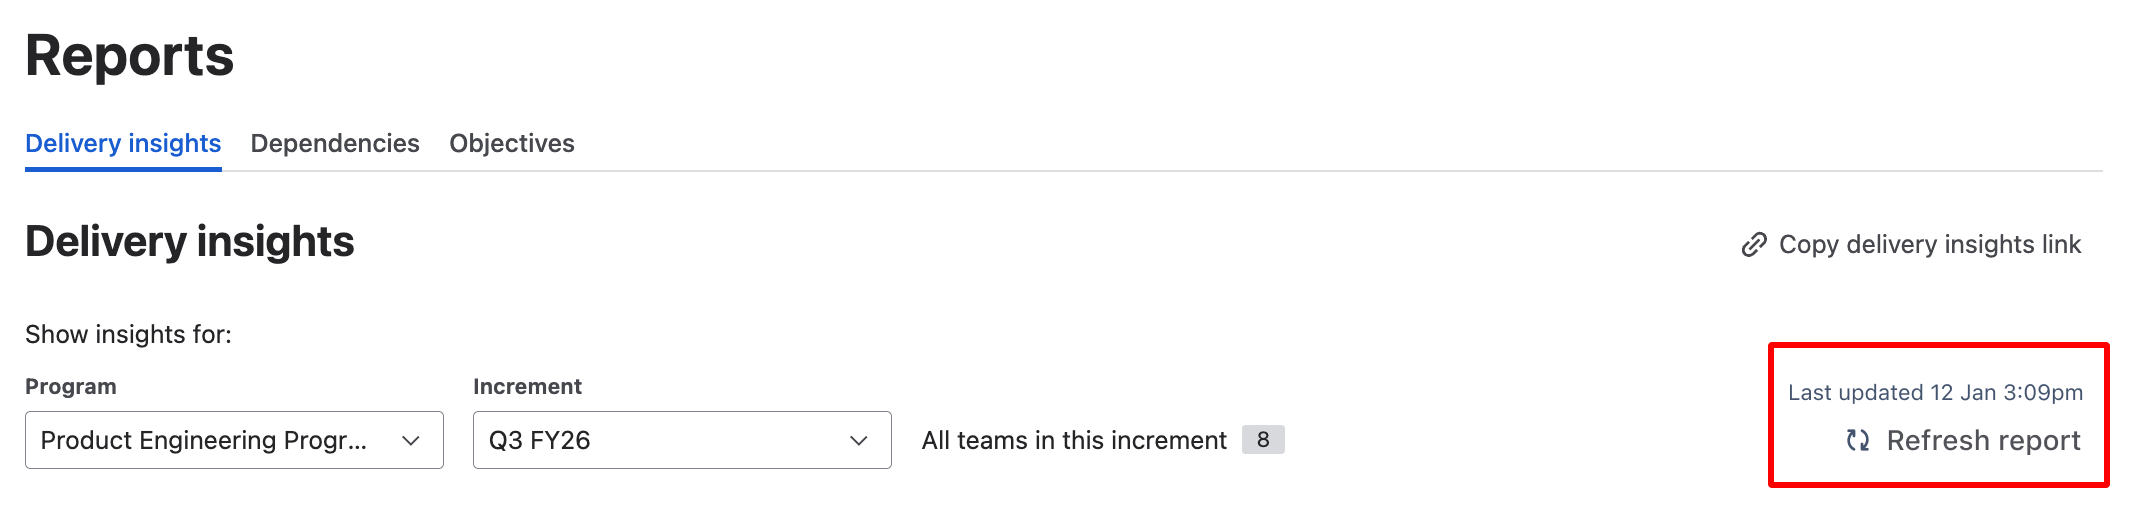
You'll only see insights when work has been completed in the selected increment. If you've created a new increment or selected a future increment, the report won't show data until teams start completing work.
Sharing insights
To share the report with stakeholders, click 'Copy delivery insights link' and paste the link. Everyone with access to the program will see the same report when they follow the link.
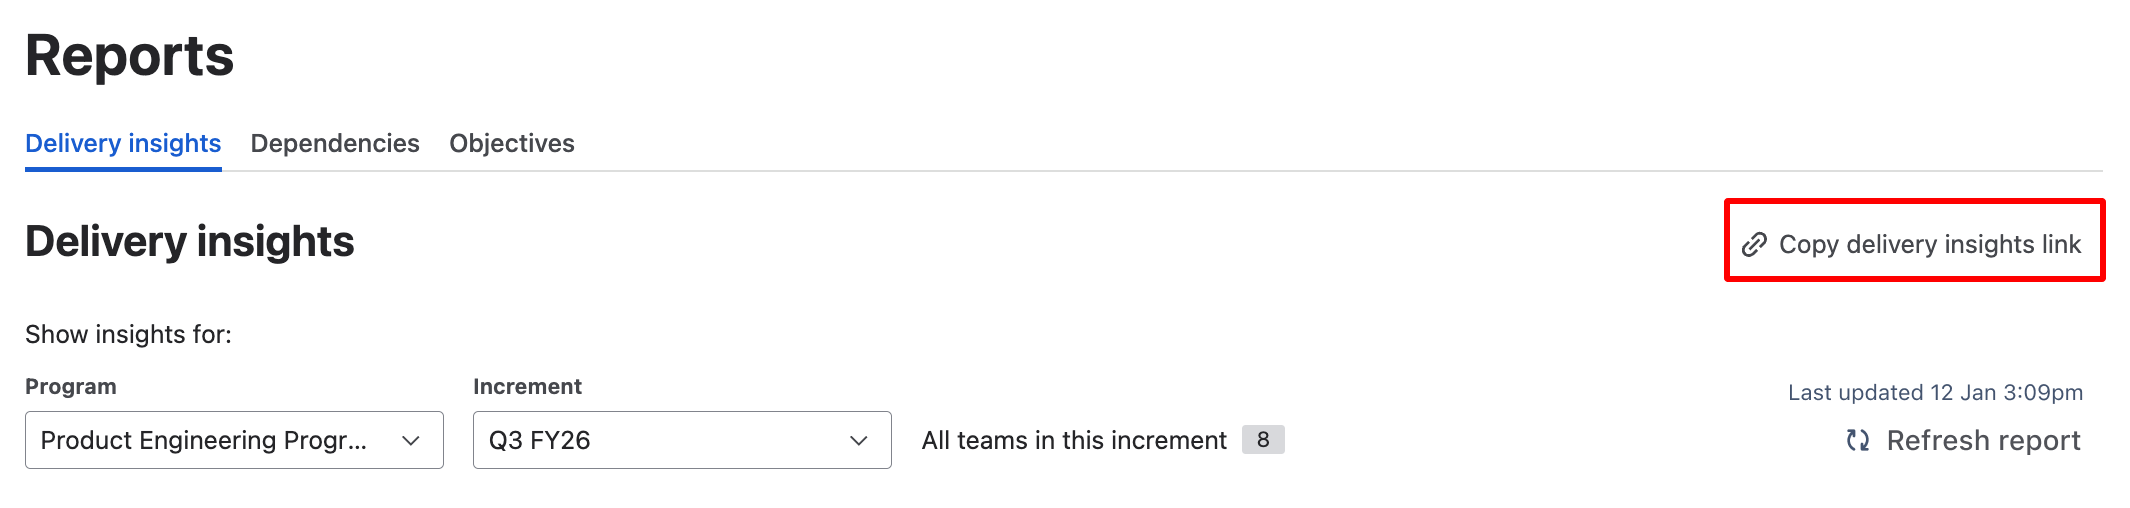
If a user only has access to selected teams or work items within a program, then their version of the report will differ from somebody with full access. A warning message will be shown when we detect that a user doesn't have full access.
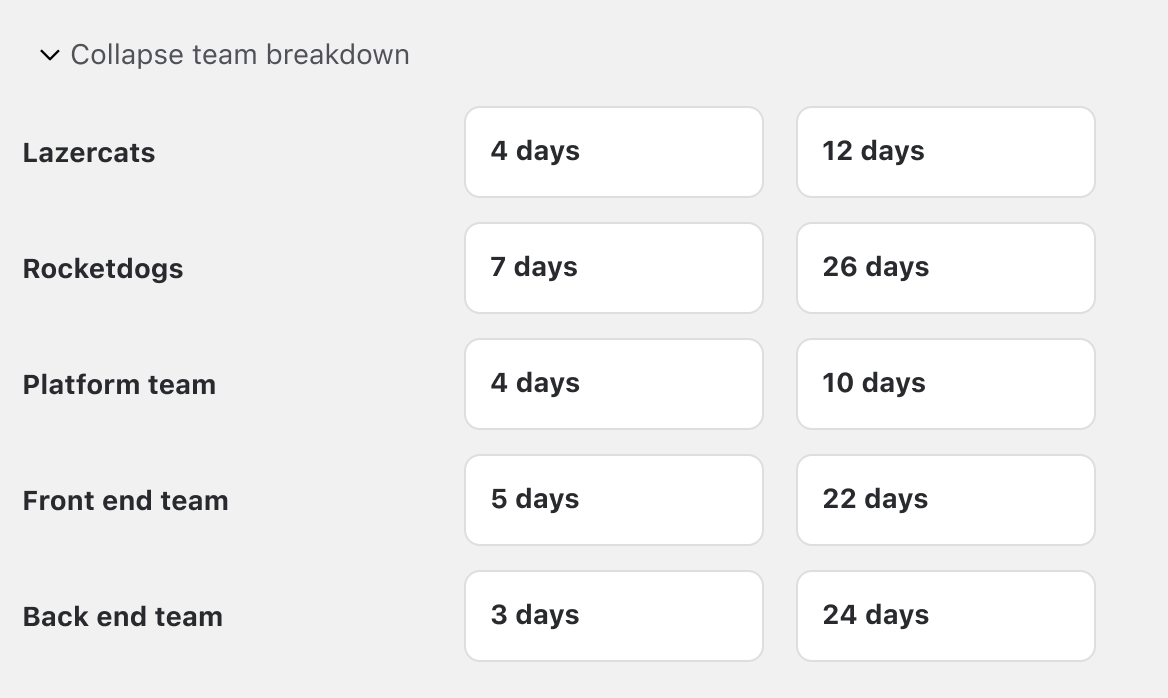
Team breakdown
Each metric section includes a collapsible team breakdown that shows the individual numbers for each team.
Expand these sections to helps you spot which teams are performing differently from the program pattern and can help you to identify teams that may need your attention. It is up to you to decide whether that's a concern or simply reflects the nature of their work.
You'll only see teams you have permission to view in Jira.
Taking action on recommendations
The recommendations in each section are conversation starters, not prescriptions. They highlight patterns worth investigating and suggest questions to explore with your teams.
You have the context about your program's current priorities, constraints, and circumstances - use these insights to guide more informed conversations about where to focus your attention.
Best practices & tips
-
Use Delivery Insights in your weekly syncs or when preparing stakeholder updates. The insights provide evidence-based conversation starters.
-
Compare team patterns to understand whether variations are concerning or simply reflect different types of work.
-
When you spot concerning patterns, dig deeper with the affected teams. The report surfaces signals - your teams have the context to understand what's driving them.
-
Incomplete or inconsistent Jira data can affect report accuracy. Encourage teams to keep their boards and workflows up to date.
FAQs
-
Why don't I see any data in the Delivery Insights report? The report only shows insights when work has been completed in the selected increment. New or future increments won't have data until teams start completing work.
-
Why does the report look different from my team mates? All users see the same report data for a given program and increment. However, you'll only see teams (Jira boards) you have permission to view in Jira.
-
How often does the data refresh? The report refreshes automatically every 7 days. You can manually refresh using the "Refresh report" button if you need the latest data sooner.
-
Can I see insights for individual teams? The team breakdown sections show metrics for each team. For deeper team-level insights with charts and trend analysis, see Team Insights in Easy Agile TeamRhythm.
Data & privacy
Our commitment
We are committed to your organisation's security and privacy, and we deeply value our unblemished SOC 2 audit history. With that in mind, we've taken a conservative approach to how we handle your data for this functionality.
How your data is protected
1. No customer data leaves your Jira instance
All of your sensitive Jira data - work item titles, descriptions, comments, assignees, and any other personally identifiable information - remains securely within your Jira instance. This data never leaves your environment.
2. We calculate metadata only
Instead of sending your actual Jira data, we calculate data about the data as the basis for our statistics. This metadata consists of aggregate numbers, percentages, and statistical measures that describe patterns in your workflow.
3. Limited identifiers transmitted
No personally identifiable information is transmitted. Identifiers are limited to only Agile Board and Jira Work Item IDs to enable:
-
Accurate insights
-
Click through to work items
4. Client-side enrichment
When the AI analysis returns, we enrich the response with Jira Work Item Keys (e.g. "USM-7780") on the client side—meaning in your browser, not on our servers. This ensures that readable work item references never leave your control.
If you have questions about how your data is handled or concerns about privacy:
-
Review our full privacy policy at https://www.easyagile.com/privacy-policy
-
Contact our support team via the Help & Support section
-
Consult with your organisation's security team
Share your feedback
We're continuously improving Delivery Insights based on your feedback.
Planned enhancements include feature level insights, visual charts, and advanced filtering. Share your feedback