
What is the Team Report?
The Team Report provides your team with clear, actionable insights into your delivery health, using your teams Jira data. It’s designed for team members, team leads, engineering managers, and agile coaches who want to understand and improve how their team works - without needing to be a flow metrics expert.
It turns flow metrics and delivery data into shared understanding, so your team can:
-
Uncover trends and bottlenecks
-
Spark meaningful discussions
-
Identify high-impact improvements
-
Build trust through transparency
Why Use the Team Report?
The Team Report is designed to amplify your team’s feedback loops:
-
Reflect with Data: See how work is really flowing through the system.
-
Improve with Confidence: Use evidence to guide your retrospectives and process changes.
-
Plan with Insight: Forecast and commit with realistic expectations.
-
Actionable recommendations: Each insight includes a suggested next step.
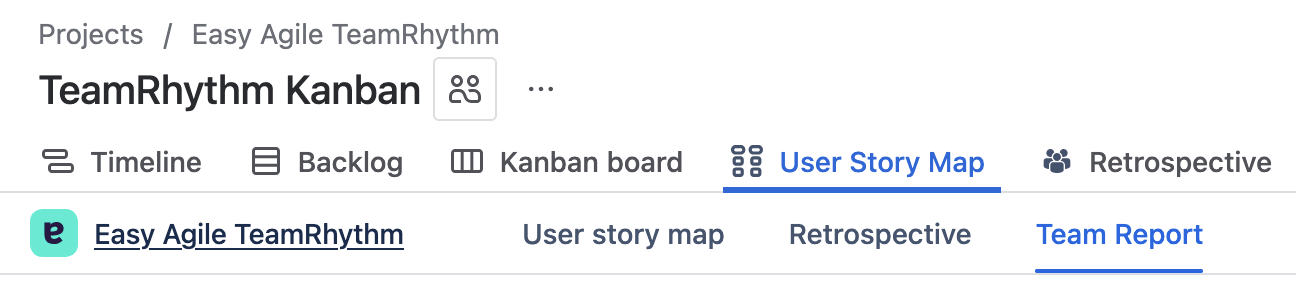
How to Access the Team Report
-
Open TeamRhythm in your Jira site
-
Navigate to the User Story Map or Retrospective tab from your board or project sidebar
-
Select the Team Report option
Understanding the Team Report
The Team Report is generated by sending aggregate metadata - no customer Jira data - to a Large Language Model (LLM) that has been trained on agile and lean terms, practices, experience and principles.
We start by looking at the quantitative data for an Agile Board in Jira and then craft aggregate metadata statistics for each of the key charts (cycle time, aging WIP, throughput). From there we pass that metadata on to the LLM which then interprets the metadata and provides insights and recommendations specific to this team at this point in time.
As we leverage a LLM for the Team Report it is important to note that the results are non-deterministic, and as such the report can vary from user to user. We specifically don’t save or cache the contents of the Team Report between individual users, as different users may have different permissions (i.e. they may not share the same list of work items even when working from the same agile board).
How to Use the Team Report
Work Item Keys - hovering over a highlighted work item key in the analysis will identify where these items are plotted on the corresponding chart. Click the key to view the items in detail without leaving the team report, enabling deeper discussions with the team without losing context.
Filtering the chart - Focus the charts by selecting the work item types in the legend. Selecting these will filter them out or add them back in to get a deeper understanding of a single item type.
Feedback - Help us continue to improve our reports by giving us feedback. Your thumbs up or thumbs down will help us understand whats working for you and what’s not. We’ll feed this back into our systems to continue to improve our analysis. Have more detailed feedback? Fill in our feedback form via the link in the banner.
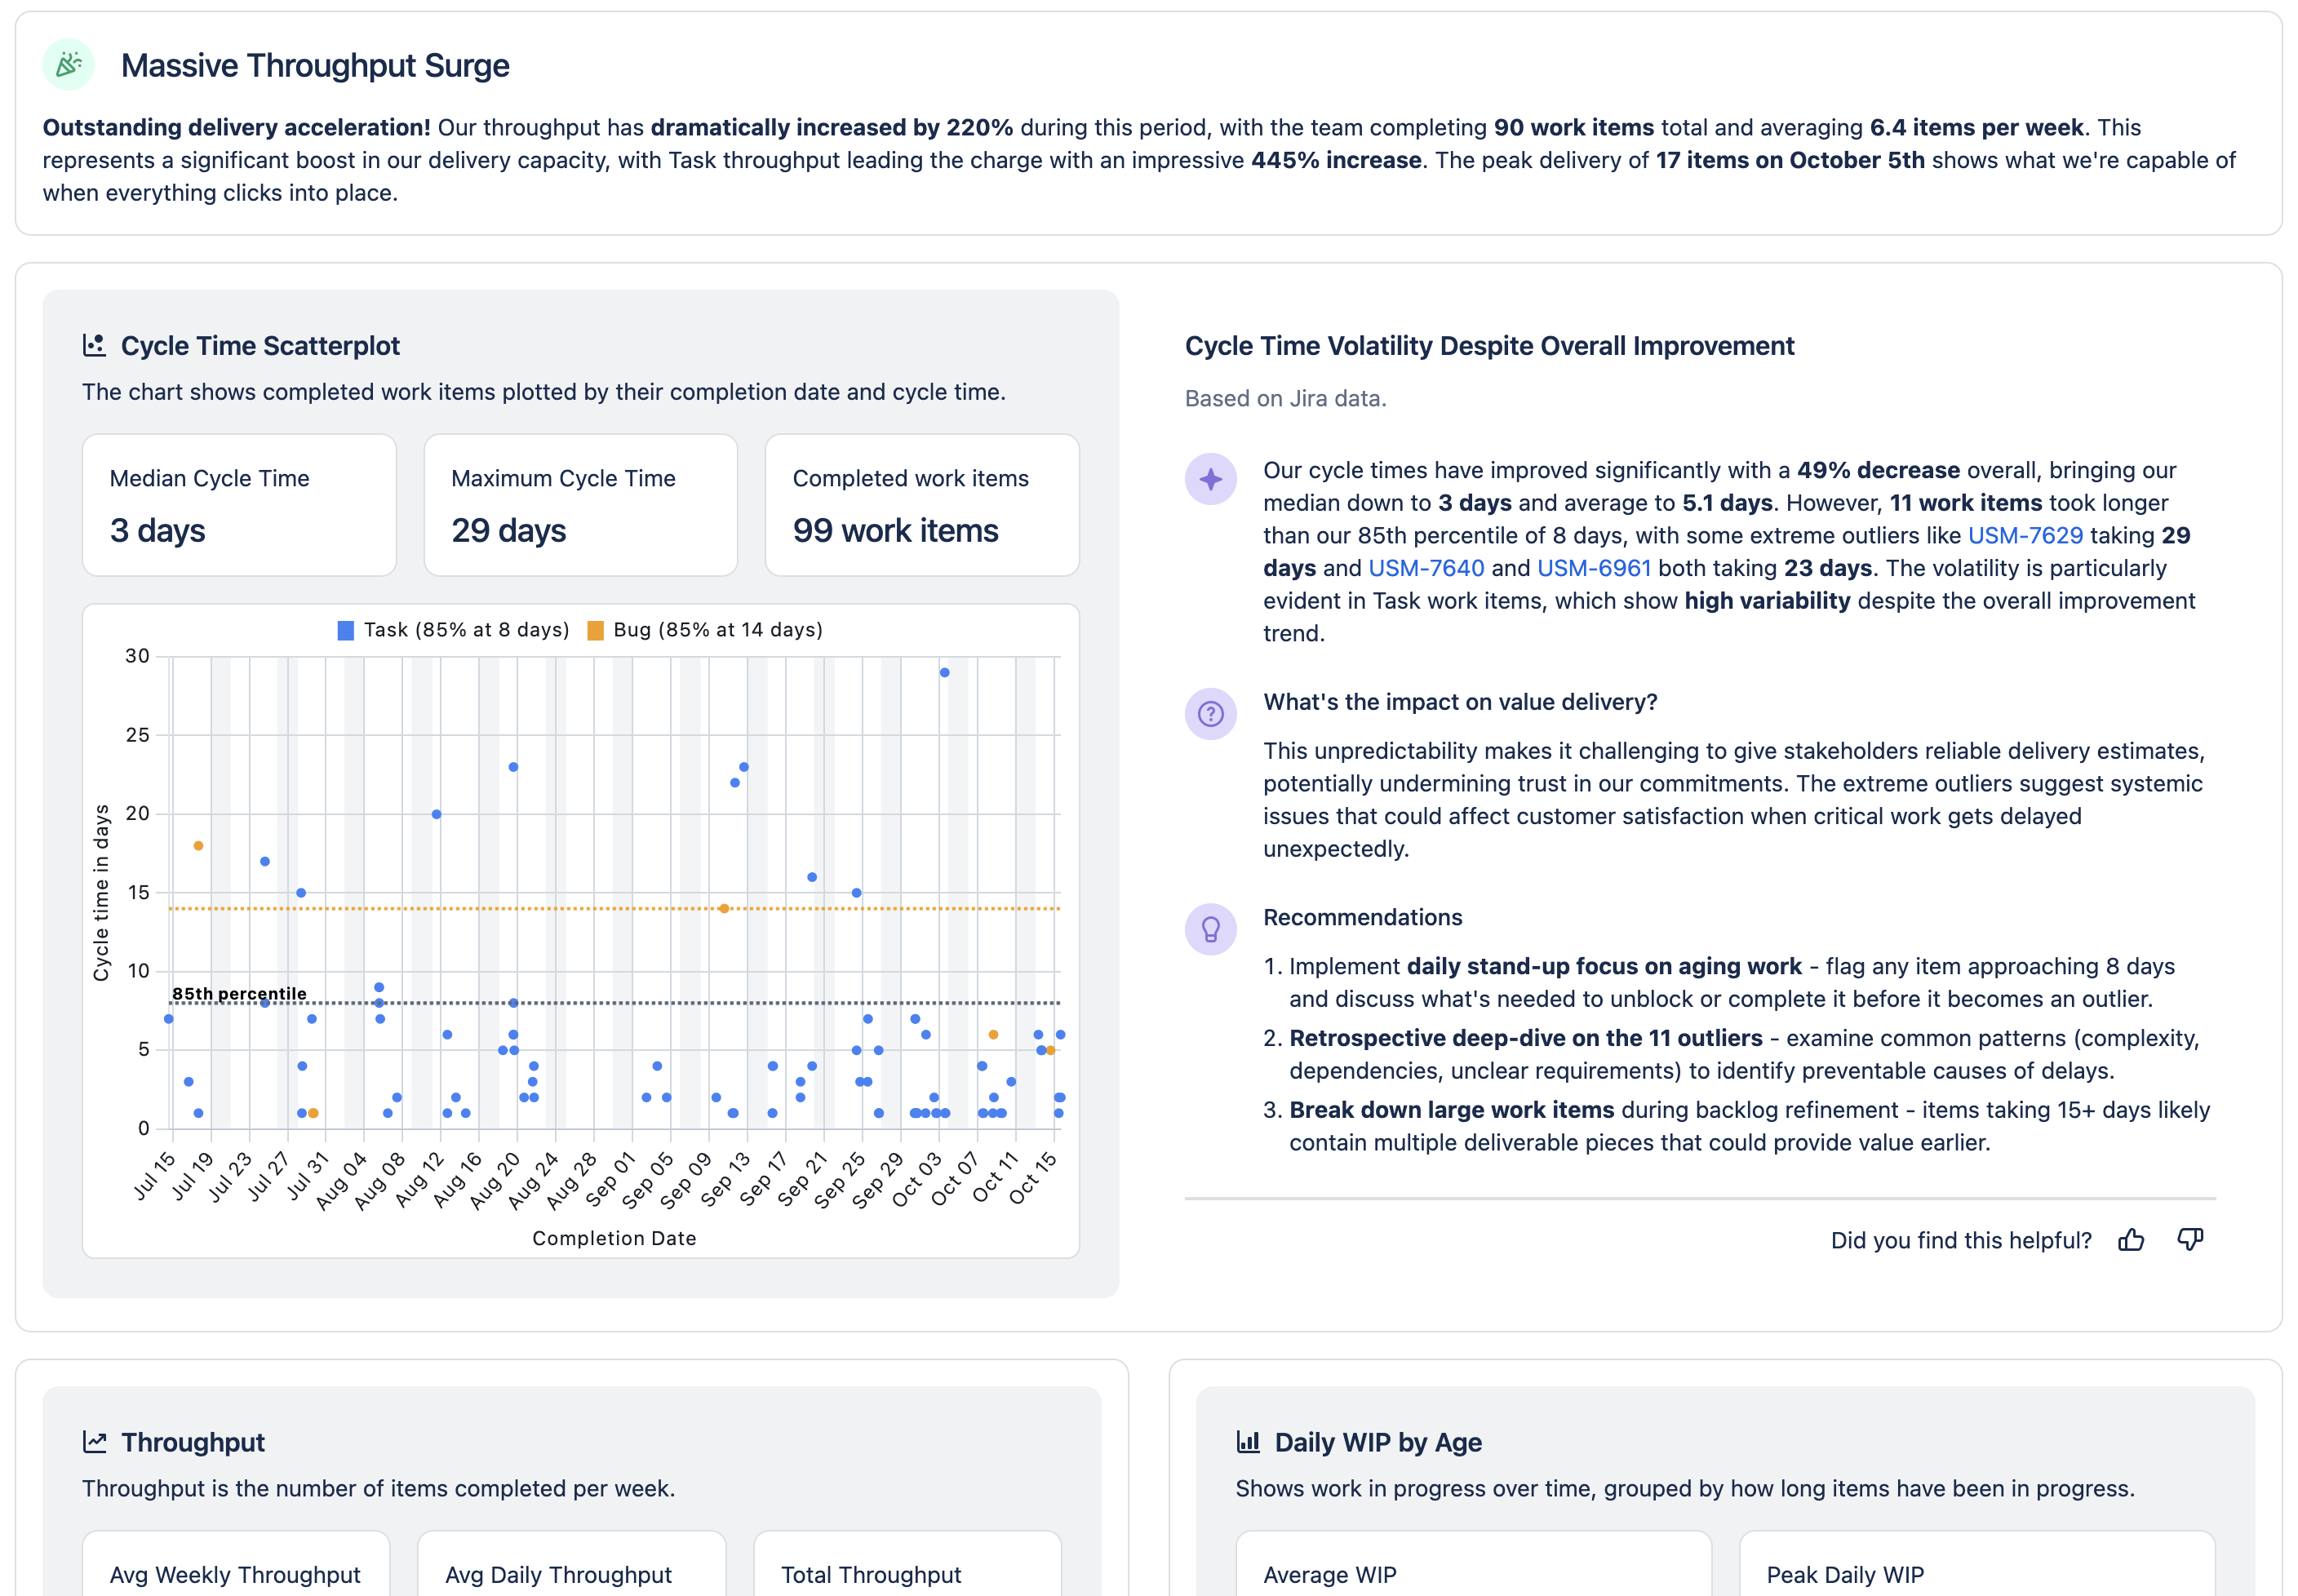
Celebration
Where we can see positive signal we start the report with encouragement, for example:
“Outstanding delivery acceleration! Our throughput has dramatically increased by 220% during this period“.
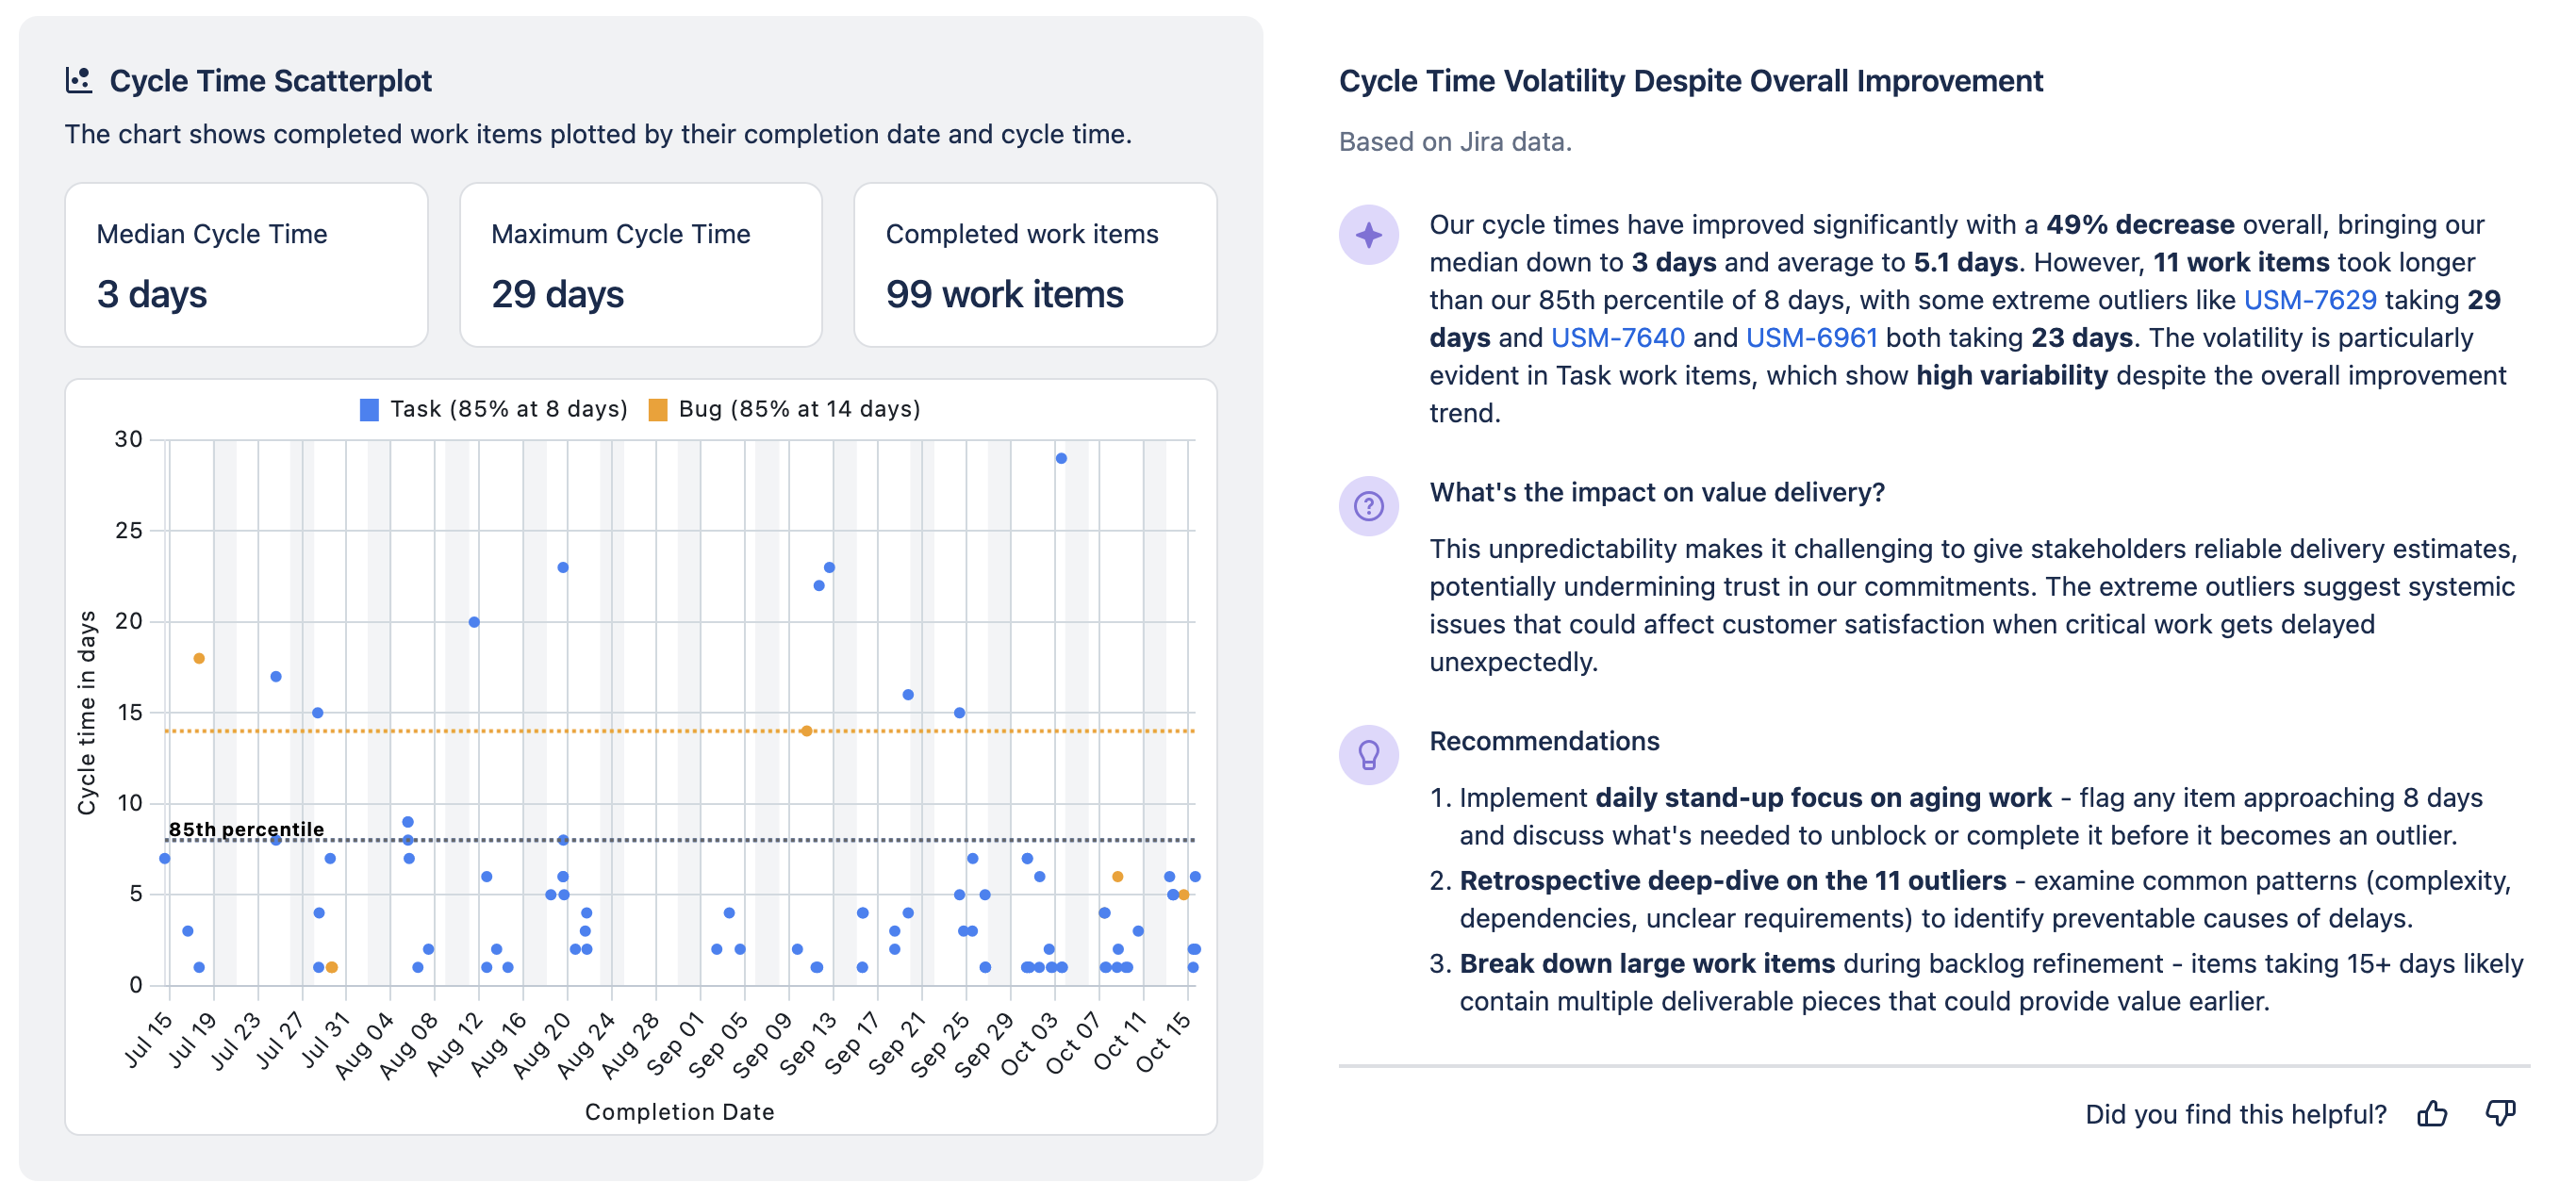
Cycle Time Scatterplot
Our primary report is the cycle time scatterplot, designed to focus the team on the flow of work items across their agile board. There is a dot on the chart for every work item that is completed in the time period, and you will see 85th percentile lines for each of the issue types.
The 85th percentile means that 85% of items are completed within this time frame; have a cycle time of this many days or less.
The accompanying commentary will flag outliers, and when a work item is hovered over in the commentary it will be highlighted on the chart to make it easy to tie the two together.
We define cycle time as the whole time a work item has spent in an In Progress status category.
Our cycle times have improved significantly with a 49% decrease overall, bringing our median down to 3 days.
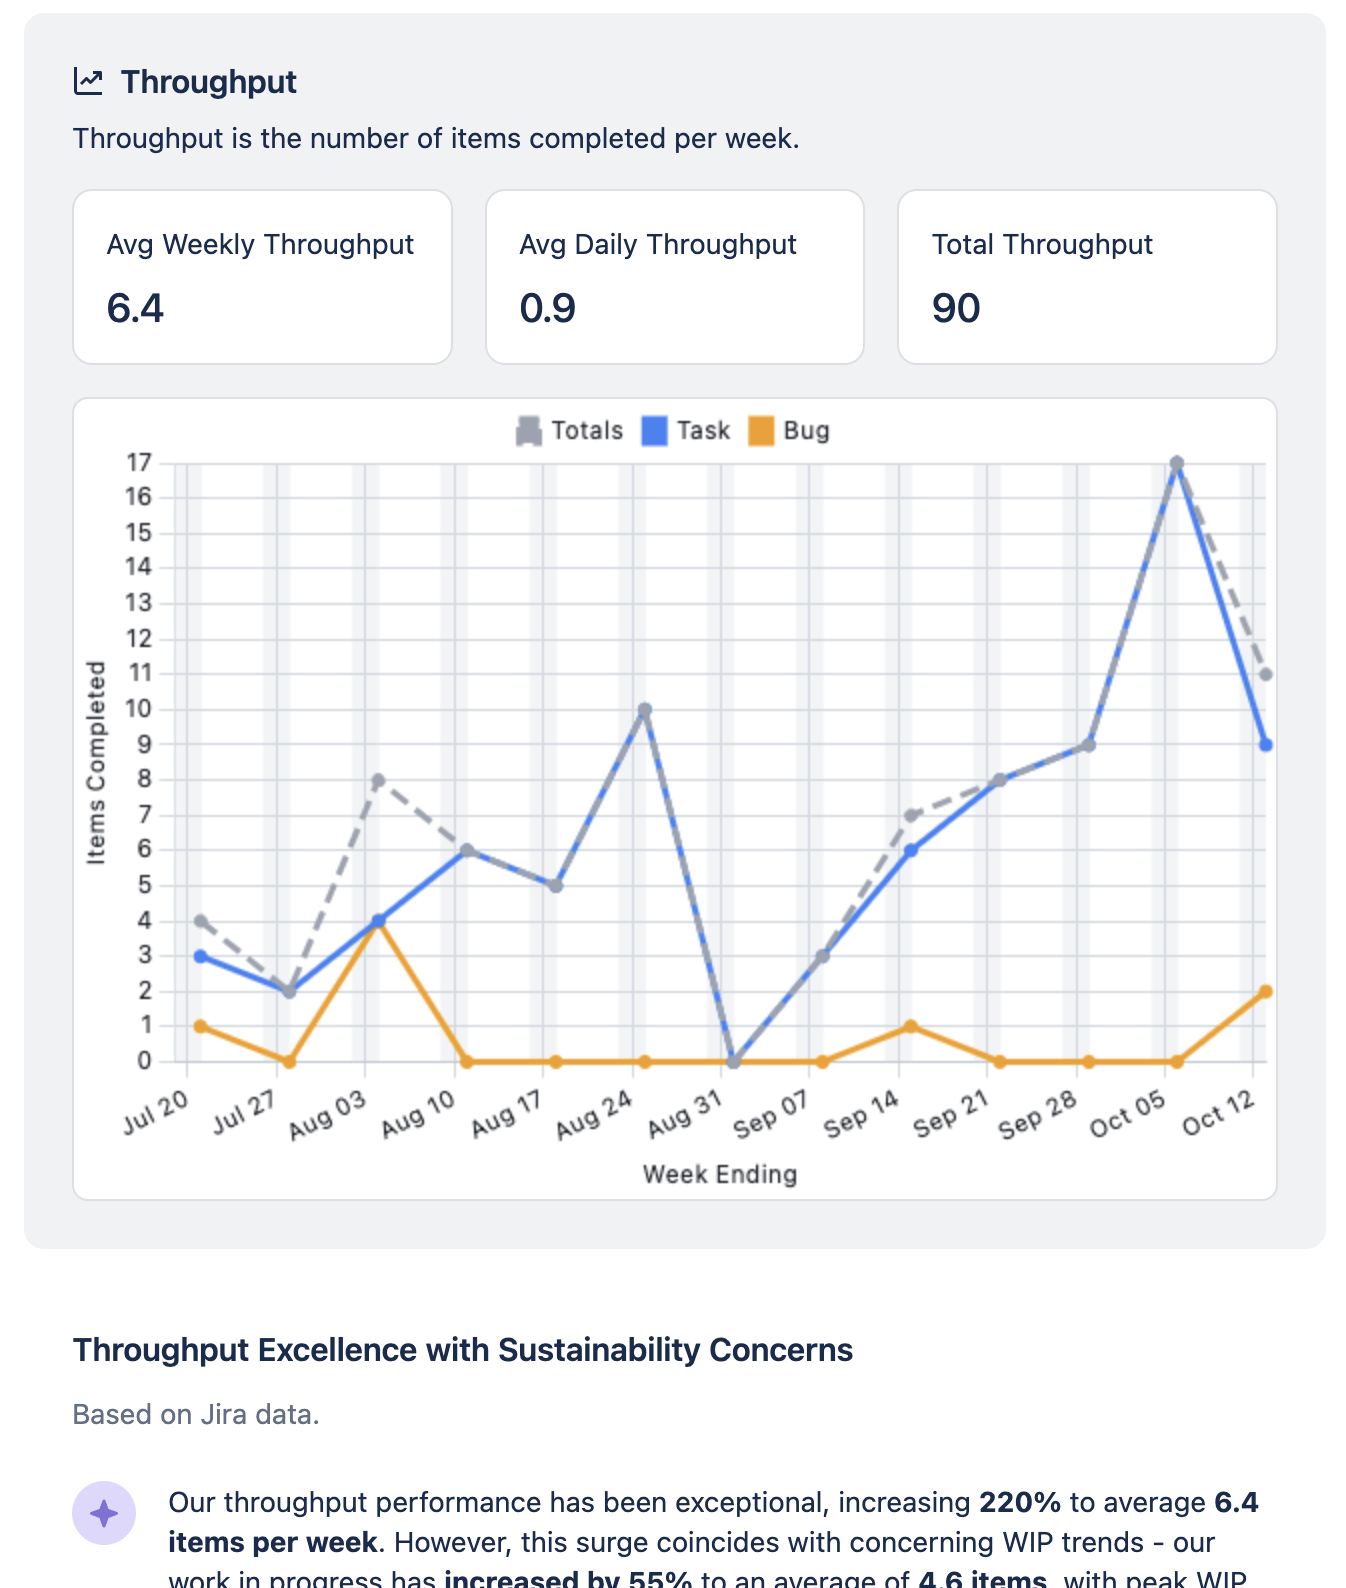
Throughput
The throughput chart shows the number of items completed each week over the time period. It provides an indication of whether the team is getting more or less work done over time and is worth correlating with the size of the team or other factors impacting the team such as holidays.
Throughput increased 15% compared to last quarter, but cycle time for stories remains high. Try breaking down large stories or reviewing blockers in your next retro.
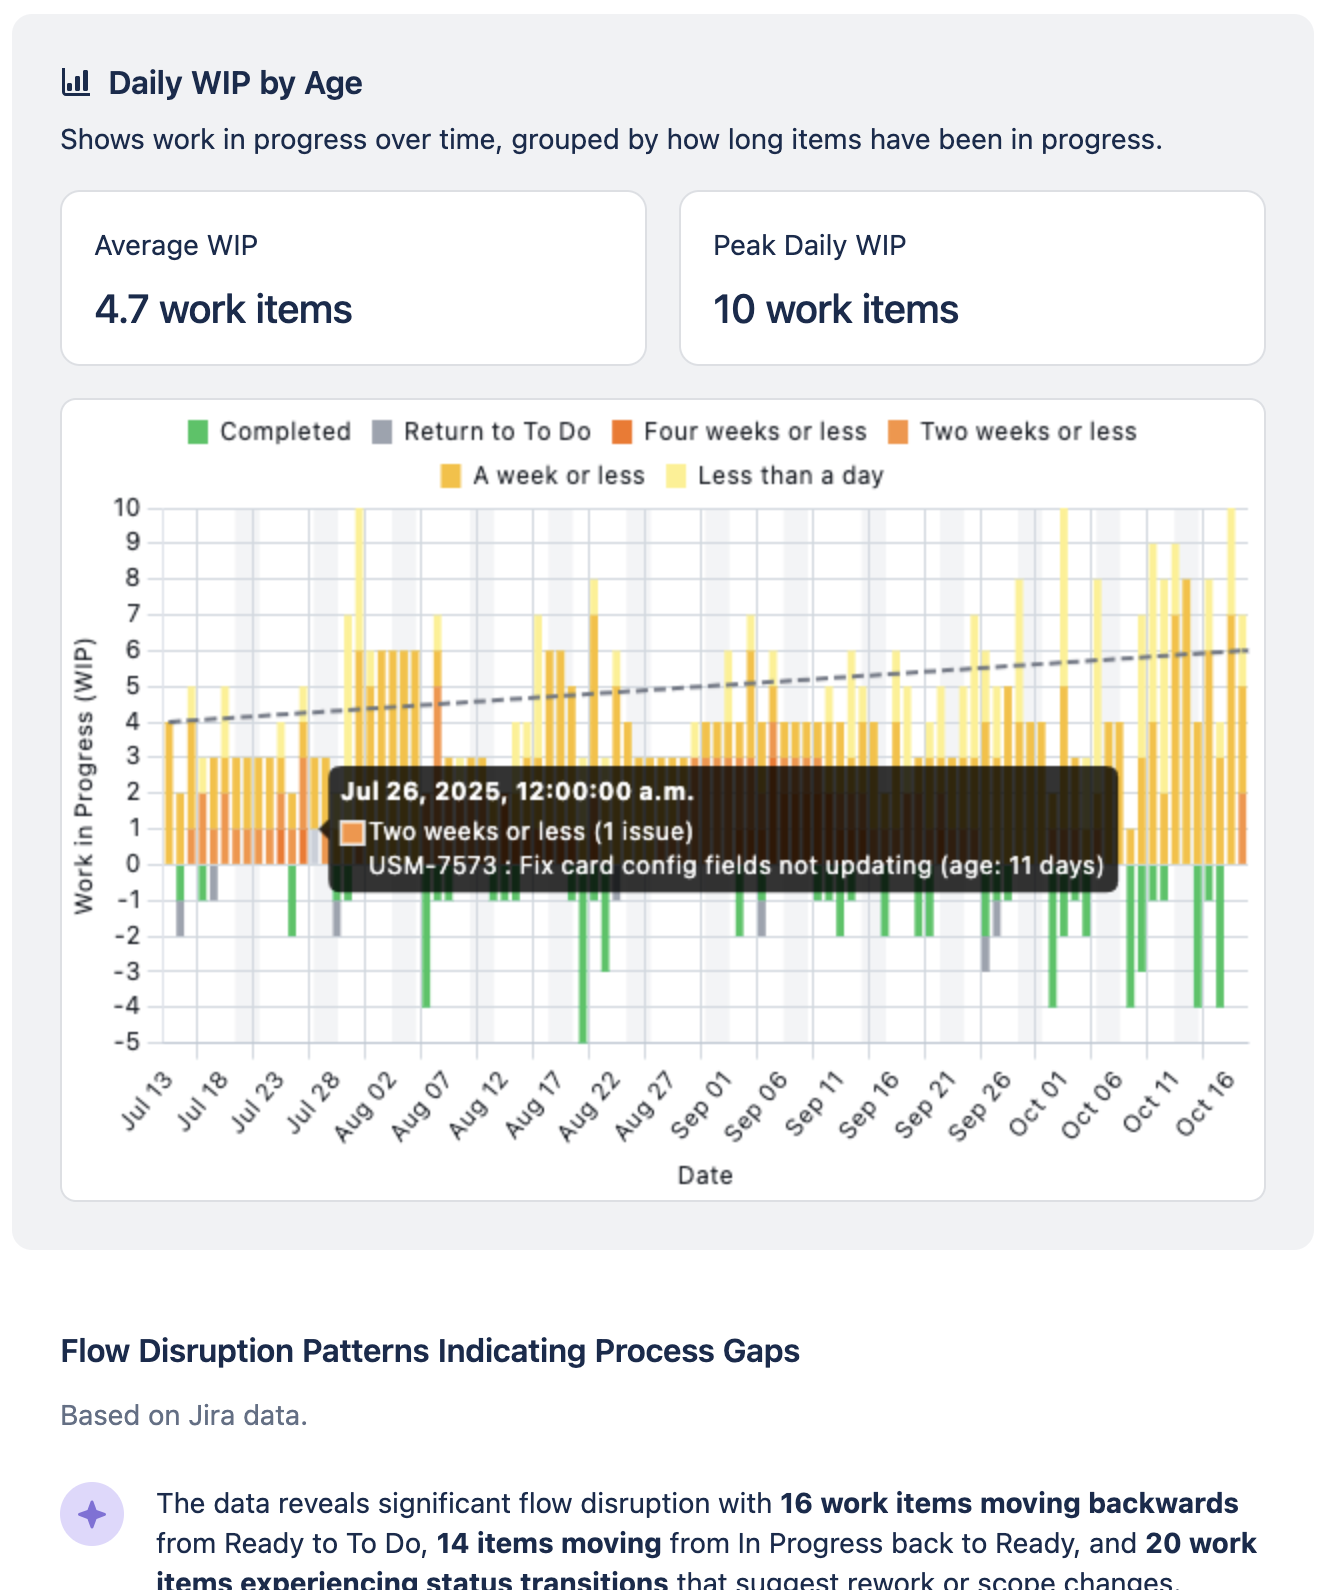
Daily WIP by Age
This chart shows how much work the team has in progress each day of the time period, and it segments this by the amount of time the work items have spent in progress. In the example below you will see there are very few issues that have been in progress for more than two weeks.
The concurrent work analysis shows 67% of team members working on multiple items simultaneously.
Data & how it is used
We are committed to your organisations security and privacy, and we also deeply value our unblemished SOC 2 audit history. With that in mind we’ve taken a conservative approach to how we handle your data for this functionality.
-
No customer data leaves your Jira instance
-
We calculate metadata - data about the data - as the basis for our statistics
-
No personally identifiable information is transmitted, only Agile Board and Jira Work Item IDs are transmitted with the metadata
-
The LLM interprets the metadata and when we return the response we enrich it with Jira Work Item Keys on the client side (i.e. in the users browser)
Example Statistics
Here is an example of the data we send to the LLM:
Best Practices & Tips
-
Use the Team Report as a conversation starter in retrospectives or team meetings. Combine quantitative insights with your team’s qualitative knowledge.
-
Issues that have particularly high cycle time, for example, can be highlighted. This allows a team to dive deep and explore what may have caused some work to take longer than anticipated.
-
Incomplete or inconsistent Jira data can affect report accuracy. Regularly review your board setup and workflow to ensure that it matches how your team gets work done.
Troubleshooting & FAQs
-
Why does my report look off?
-
New board or recent migration? Wait until you have at least 90 days of data.
-
Data quality issues? Check for unmapped statuses or inconsistent workflows.
-
Seeing Scrum terms on a Kanban board? Let us know - language is being improved for team context.
-
-
Can I add my own context or notes?
Not yet, but this is a top-requested feature. For now, discuss findings in your team’s retro and document key decisions. -
How do I use these insights?
Each recommendation is designed to be actionable. Try one change per sprint and track the impact over time.
Feedback & Improvements
We’re actively improving the Team Report based on your feedback.
Have feedback or a feature request? Let us know or use the feedback link at the top of the Team Report tab.